
|
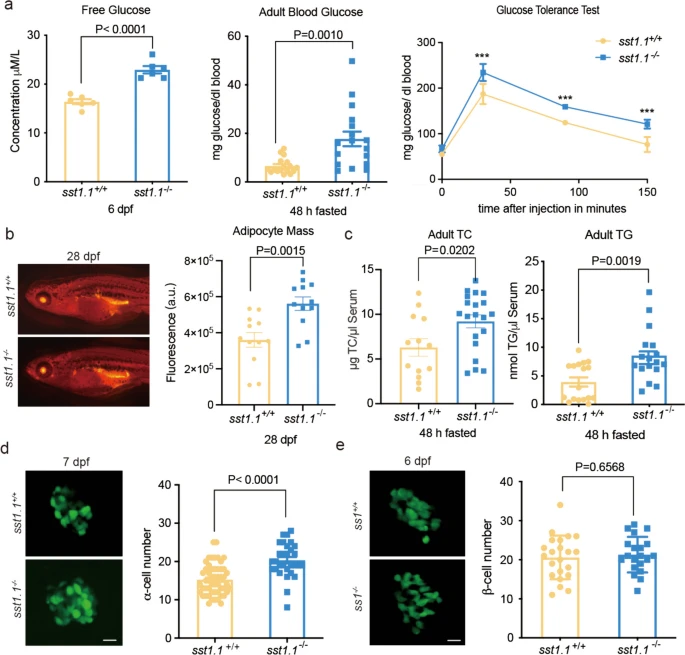
Fig. 3 Metabolic characteristics of the sst1.1−/− mutant under normal feeding. a The sst1.1−/− mutant had higher glucose levels than sst1.1+/+ in both (left) whole larvae and (centre) adult blood, as well as (right) decreased glucose clearance; Additional file: Table S2; *** P<0.001. b Left, Nile red staining fluorescence and (right) the corresponding histogram of fluorescence optical density showing the sst1.1−/− mutant had more visceral fat than WT. c The sst1.1−/− mutant had lower blood total cholesterol and higher triglyceride than WT. d Crossing the sst1.1−/− mutant with a Tg(gcg:GFP) zebrafish line allowed (left) visualisation and (right) counting of α-cells to establish that Sst1.1 deficiency caused α-cell proliferation. e Crossing the sst1.1−/− mutant with a Tg(-1.2ins:GFP) zebrafish line (left) allowed visualisation and (right) counting of β-cells to establish that there was no effect of Sst1.1 deficiency on the β-cell number. Data are shown as mean ± standard error of the mean