
Fig. 4
- ID
- ZDB-FIG-240731-58
- Publication
- Chen et al., 2024 - Somatostatin signalling coordinates energy metabolism allocation to reproduction in zebrafish
- Other Figures
- All Figure Page
- Back to All Figure Page
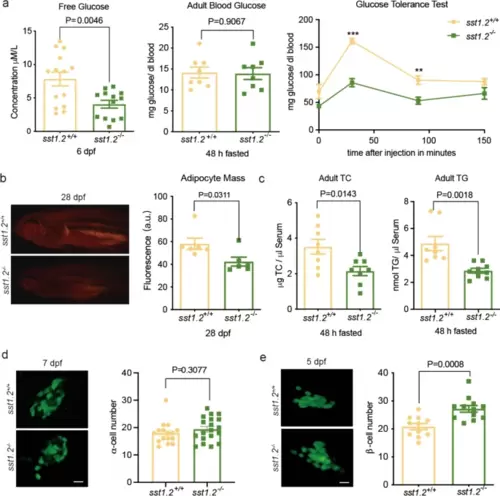
Metabolic characteristics of the sst1.2−/− mutant under normal feeding. a Left, the sst1.2−/− mutant larvae had lower glucose content than WT, but there were no differences in adult mutant and WT blood glucose. Right, Adult sst1.2−/− mutant had greater glucose clearance than WT; Additional file: Table S2, *** P<0.001, ** P<0.01. b Left, Nile red staining fluorescence and (right) the corresponding histogram of fluorescence optical density showing the sst1.2−/− mutant had less visceral fat than WT. c Left, the sst1.2−/− mutant also had lower blood total cholesterol and (right) triglyceride than WT. d Left, crossing the sst1.2−/− mutant with a Tg(gcg:GFP) zebrafish line allowed visualisation and counting of α-cells (right) and established that sst1.2 deficiency did not affect α-cell proliferation. e Crossing the sst1.2−/− mutant with a Tg(-1.2ins:GFP) zebrafish line allowed (left) visualisation and (right) counting of β-cells to establish that sst1.2 deficiency caused β-cell proliferation. Data are shown as mean ± standard error of the mean |