
- Title
-
Stilbenoids from fenugreek seeds alleviate insulin resistance by regulating the PI3K/AKT/mTOR signaling pathway in a type 2 diabetes zebrafish model
- Authors
- Gao, Y., Wu, Y., Tie, F., Wang, H.
- Source
- Full text @ Heliyon
|
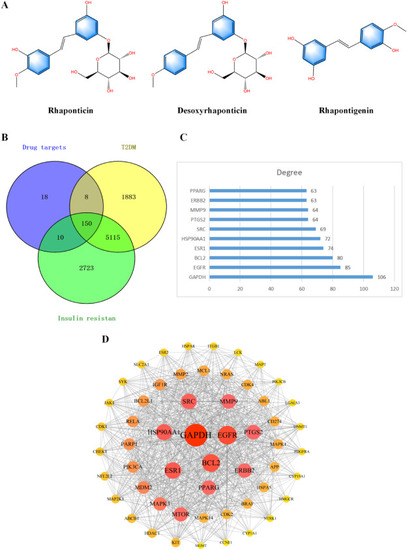
Network pharmacology prediction.(A) The structural formula of RHAc, dRHAc and RHAg.(B)Direct targets of RHAc, dRHAc and RHAg.(C)PPI and network topology analysis.(D)Degree value of the top ten targets. (E)GO enrichment analysis.(F)KEGG pathway analysis.(G)Network of ‘T2DM-Stilbenoids-target-pathway’. 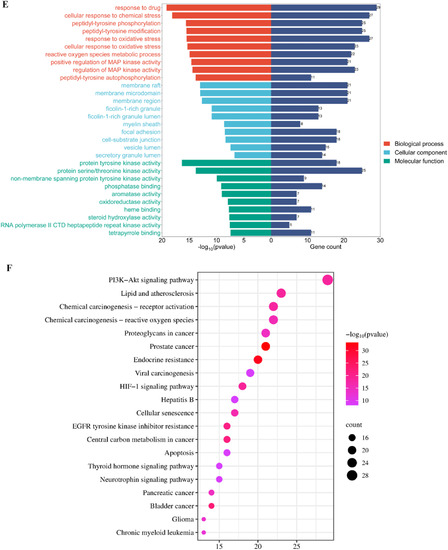

|
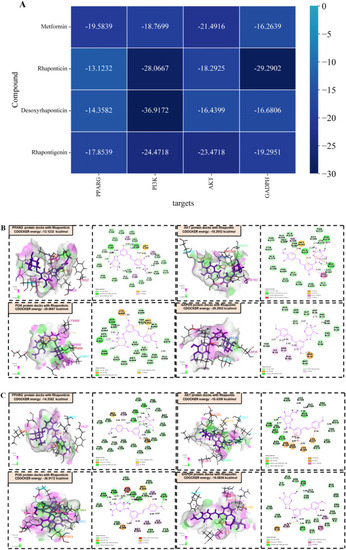
Heat map of the optimal docking score between the individual compounds and target proteins based on the binding energy(A)Visualization of the molecular docking results of RHAc (B), dRHAc (C) and RHAg (D). |

(A) Glucose levels of adult zebrafish in each group. (B) TC levels of adult zebrafish in each group. (C) TG levels of adult zebrafish in each group. (D) LDL-C levels of adult zebrafish in each group. (E) HDL-C levels of adult zebrafish in each group. (F) Effect of stilbenoids on the liver tissue morphology and Oil red O staining of adult zebrafish.(G)Area of lipid vacuolization.(H)Relative absorbance of Oil-Red-O stain Values are expressed as the mean ± SD in each group. #p < 0.05 and ##p < 0.001 model group versus Con group. *p < 0.05 and **p < 0.001 treatment group versus model group. (For interpretation of the references to color in this figure legend, the reader is referred to the Web version of this article.) |

(A) Glucose levels of zebrafish larvae in each group. (B) TG levels of zebrafish larvae in each group. (C) TC levels of zebrafish larvae in each group. (D) LDL-C levels of zebrafish larvae in each group. (E) HDL-C levels of zebrafish larvae in each group.(F)2-NDBG staining of zebrafish larvae.(G)Mean fluorescence intensity of 2-NDBG.(J)Whole-mount Oil red O staining of zebrafish larvae (the yellow area indicates the liver). Values are expressed as the mean ± SD in each group. #p < 0.05 and ##p < 0.001 model group versus Con group. *p < 0.05 and **p < 0.001 treatment group versus model group. (For interpretation of the references to color in this figure legend, the reader is referred to the Web version of this article.) |

Effect of stilbenoids on relevant gene expression.(A) mRNA expression of INS in zebrafish larvae.(B) mRNA expression of INSRA in zebrafish larvae.(C) mRNA expression of GCG in zebrafish larvae.(D) The mRNA expression level of PPARG in zabrafish larvae.(E) The mRNA expression level of mTORC1 in zebrafish larvae.(F) The mRNA expression level of PI3K in zebrafish larvae.(G)The mRNA expression level of AKT2 in zebrafish larvae.(H) The mRNA expression level of GAPDH in zebrafish larvae.Values are expressed as the mean ± SD in each group. #p < 0.05 and ##p < 0.001 model group versus Con group. *p < 0.05 and **p < 0.001 treatment group versus model group. |
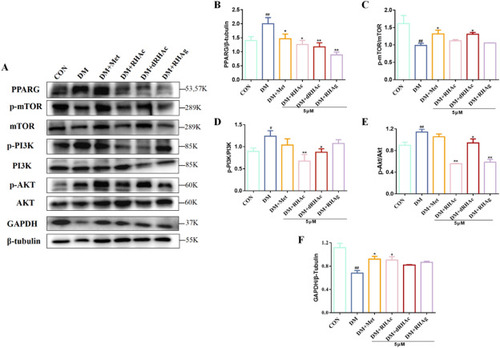
Stilbenoids changes the expression of PPARG, mTOR,PI3K, AKT and GAPDH in zebrafish larvae. (A)Protein banding. (B)Gray analysis diagram of PPARG (C)Gray analysis diagram of mTOR.(D)Gray analysis diagram of PI3K(E)Gray analysis diagram of AKT.(F)Gray analysis diagram of GAPDH. |