
|
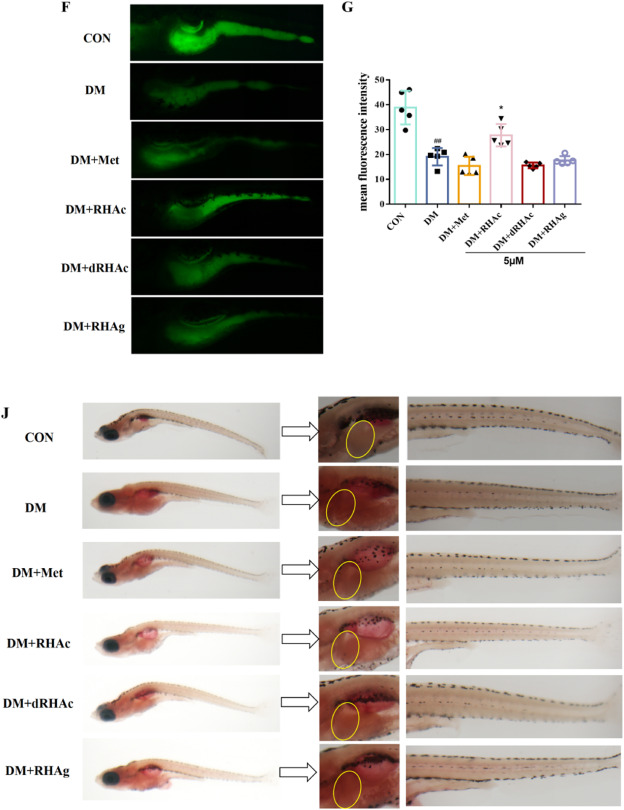
Fig. 4 (A) Glucose levels of zebrafish larvae in each group. (B) TG levels of zebrafish larvae in each group. (C) TC levels of zebrafish larvae in each group. (D) LDL-C levels of zebrafish larvae in each group. (E) HDL-C levels of zebrafish larvae in each group.(F)2-NDBG staining of zebrafish larvae.(G)Mean fluorescence intensity of 2-NDBG.(J)Whole-mount Oil red O staining of zebrafish larvae (the yellow area indicates the liver). Values are expressed as the mean ± SD in each group. #p < 0.05 and ##p < 0.001 model group versus Con group. *p < 0.05 and **p < 0.001 treatment group versus model group. (For interpretation of the references to color in this figure legend, the reader is referred to the Web version of this article.)