
Image
|
Figure Caption
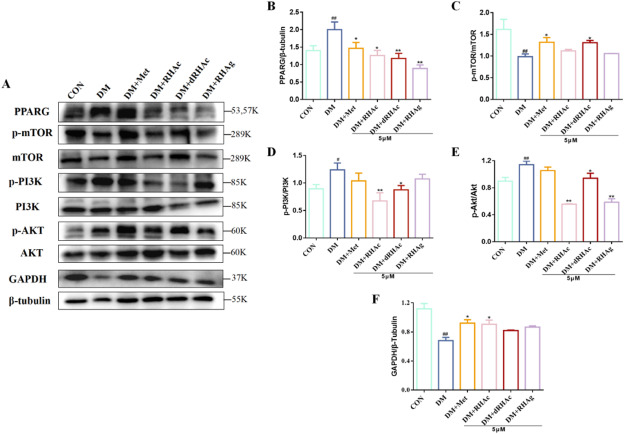
Fig. 6 Stilbenoids changes the expression of PPARG, mTOR,PI3K, AKT and GAPDH in zebrafish larvae. (A)Protein banding. (B)Gray analysis diagram of PPARG (C)Gray analysis diagram of mTOR.(D)Gray analysis diagram of PI3K(E)Gray analysis diagram of AKT.(F)Gray analysis diagram of GAPDH.
Acknowledgments
This image is the copyrighted work of the attributed author or publisher, and
ZFIN has permission only to display this image to its users.
Additional permissions should be obtained from the applicable author or publisher of the image.
Full text @ Heliyon