
Image
|
Figure Caption
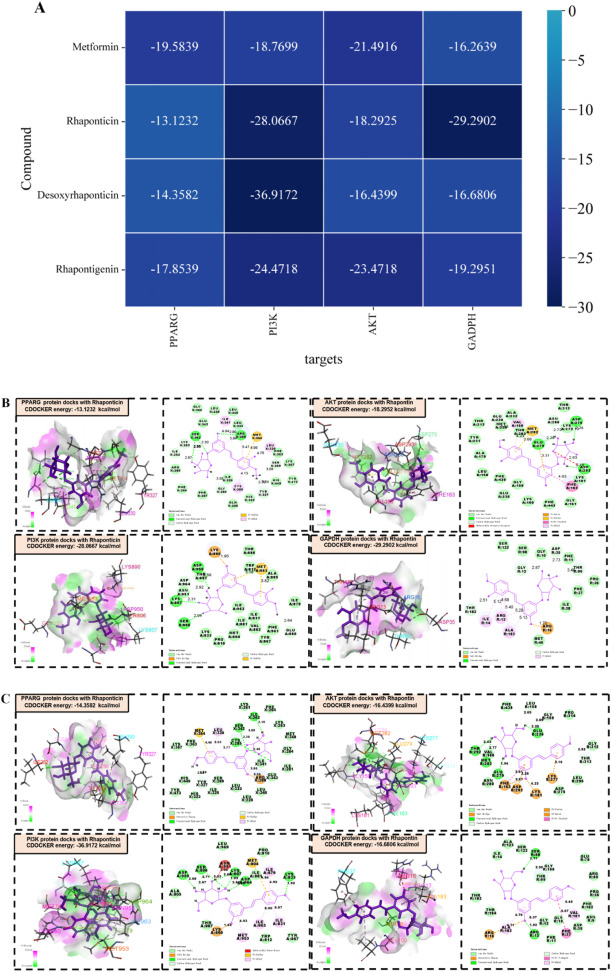
Fig. 2 Heat map of the optimal docking score between the individual compounds and target proteins based on the binding energy(A)Visualization of the molecular docking results of RHAc (B), dRHAc (C) and RHAg (D).
Acknowledgments
This image is the copyrighted work of the attributed author or publisher, and
ZFIN has permission only to display this image to its users.
Additional permissions should be obtained from the applicable author or publisher of the image.
Full text @ Heliyon