
- Title
-
Targeting monocytic Occludin impairs transendothelial migration and HIV neuroinvasion
- Authors
- Brychka, D., Ayala-Nunez, N.V., Dupas, A., Bare, Y., Partiot, E., Mittelheisser, V., Lucansky, V., Goetz, J.G., Osmani, N., Gaudin, R.
- Source
- Full text @ EMBO Rep.
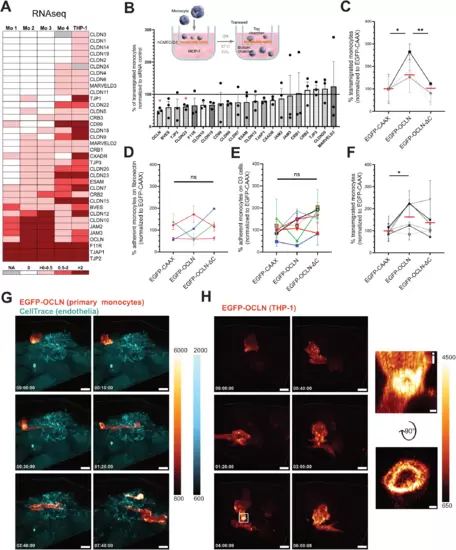
Monocytic OCLN favors monocyte transmigration across the BBB-like endothelium. (A) Heatmap of TJAP-coding mRNAs in human primary monocytes and the THP-1 cell line based on existing RNAseq databases (see Methods). (B) siRNA screen on monocytic TJAP proteins to define their role in transmigration. The scheme represents the experimental setup of a transmigration assay with monocytes crossing a confluent monolayer of brain endothelial cells (hCMEC/D3). TJAPs were selected based on the heatmap shown in A. THP-1 cells were electroporated with the indicated siRNAs and added to the top chamber for 17 h (overnight). The data is presented as percentage of transmigrated THP-1 cells normalized to the siRNA control (black line). The graph shows n = 3 independent experiments performed at least in two technical replicates. (C) Percentage of transmigrated OCLN KO THP-1 cells rescued either with EGFP-CAAX, EGFP-OCLN, or EGFP-OCLN-ΔC across hCMEC/D3 monolayer. The data were obtained from n = 3 individual experiments performed in two technical replicates normalized to EGFP-CAAX of each experiment. Each symbol’s color corresponds to an individual experiment. Red dashes represent the mean of experiments combined together. (D) Percentage of adherent primary monocytes expressing EGFP-CAAX, EGFP-OCLN, or EGFP-OCLN-ΔC on fibronectin substrate measured by flow cytometry. Adhesion time is 30 min. The data were obtained from n = 4 monocyte donors. Data were normalized to the average of EGFP-CAAX obtained from each experiment. Each symbol’s color corresponds to an individual monocyte donor. (E) Percentage of adherent primary monocytes expressing EGFP-CAAX, EGFP-OCLN, or EGFP-OCLN-ΔC on hCMEC/D3 monolayer measured by flow cytometry. Adhesion time is 30 min. The data represents the mean values obtained from n = 7 monocyte donors. Data were normalized to the average of EGFP-CAAX obtained from each experiment. Each symbol’s color corresponds to an individual monocyte donor. Error bars are SEM. (F) Percentage of transmigrated primary monocytes expressing EGFP-CAAX, EGFP-OCLN, or EGFP-OCLN-ΔC across hCMEC/D3 monolayer. The data were obtained from n = 6 monocyte donors. Data were normalized to the average of EGFP-CAAX obtained from each experiment. Each symbol’s color corresponds to an individual monocyte donor. (G, H) 3D time-lapse spinning disk confocal microscopy of transmigrating monocytes. Fluorescence intensity scale is shown on the side of each panel. EGFP is represented using the “red Fire” color-coding, and endothelial cells are stained with a CellTrace marker (cyan) added prior to the addition of the monocytes. Timescales are shown is the bottom right corner and correspond to the time after which imaging acquisition started. (G) Imaging of a primary monocyte transduced with EGFP-OCLN on hCMEC/D3 monolayer. Images were taken every 10 min. Scale bar: 10 μm. Full video can be found in Movie EV1. (H) Imaging of a THP-1 cell transduced with EGFP-OCLN on hCMEC/D3 monolayer (not stained). Images were taken every 10 min. Scale bar: 8 μm. Full video can be found in Movie EV2. The white square highlights OCLN accumulation at the potential interface between hCMEC/D3 cells and the THP-1 cell. (i) Enlarged image from the white square and a 90° flip showing the accumulation of OCLN. Scale bar: 0.7 µm. Data information: In (B, C, F), data are presented as mean ± SEM. In (D, E), error bars represent SEM. Two-tailed Student’s t-test p value < 0.05 (*), < 0.01 (**) or non-significant (ns). Source data are available online for this figure. |

OCLN-derived EL2 peptide inhibits monocyte transmigration across the BBB-like endothelium. (A) Schematic representation of OCLN (green) at the PM with OCLN-derived peptides highlighted in red (see sequence in Methods). (B) Permeability of hCMEC/D3 monolayer after overnight exposure of the monolayer to OCLN-derived peptides or their scramble controls. The data were obtained from n = 3 individual experiments. (C) Adhesion of primary monocytes on fibronectin after pre-incubation with OCLN-derived peptides or their scramble controls for 1 h measured with CellTiter Glo. Adhesion time is 30 min. The data were obtained from n = 4 donors in 2 individual experiments. Data were normalized to DMSO for each experiment. (D) Percentage of primary monocytes after 1 h exposure to OCLN-derived peptides or their scramble controls that transmigrated across the hCMEC/D3 monolayer overnight. The data were obtained from n = 8 individual experiments using 13 donors and normalized to the average DMSO for each experiment. Data information: In (B–D), data are presented as mean ± SEM. Two-tailed Student’s t-test p value < 0.05 (*), <0.01 (**), <0.001 (***) or non-significant (ns). Source data are available online for this figure. |

OCLN-derived EL2 peptide inhibits human monocyte transmigration in vivo. (A) Representative scheme of the experimental design associated with the zebrafish model. Human primary monocytes were labeled with CellTrace, and injected into the duct of Cuvier of Tg(fli1a:eGFP-CAAX) zebrafish embryos (GFP-labeled endothelial cells). (B) Zebrafish imaging was done at 6–8 h post injection by spinning-disk confocal microscopy. Representative z-projection of confocal images of monocytes from patient X arrested in the vasculature at the tail of a zebrafish embryo at 6 h post injection Scale bar: 100 µm. (C) Representative images and orthoslice of monocytes at 6 hpi. Scale bar: 50 µm. (D) Violin plots of the ratio of extravasated monocytes from four donors (merged and seperated) at 6–8 h post injection. Each dot represents the ratio calculated from all the monocytes tracked within a fish. The data were obtained from n = 4 individual experiments using four different monocyte donors with nDMSO = 21, nEL1 = 31, nEL2 = 25 in total (nDMSO = 7, nEL1 = 10, nEL2 = 6 for donor W; nDMSO = 6, nEL1 = 7, nEL2 = 4 for donor X; nDMSO = 6, nEL1 = 8, nEL2 = 8 for donor Y; nDMSO = 2, nEL1 = 6, nEL2 = 7 for donor Z). P value < 0.05 (*), and <0.0001 (***). Data information: In (D), data are presented as violin plots showing min/max values and quartiles (dotted lines). Statistical difference of non-Gaussian datasets was analyzed using Kruskal–Wallis test with Dunn’s post hoc test p value < 0.05 (*), < 0.001 (***) or non-significant (ns). Source data are available online for this figure. |

OCLN-derived EL2 peptide inhibits HIV-1 neuroinvasion. (A) Primary monocytes were infected for 48 h at MOI 1 with HIV-1 (NLAD8) and added to the top chamber of transwells containing a hCMEC/D3 monolayer to allow transmigration to occur. After overnight incubation, the bottom chamber was harvested and the number of transmigrated monocytes was counted. The dot plot shows the mean of the fold change of the number of HIV-exposed monocytes over non-infected counterparts. Each dot corresponds to a donor. (B) Primary monocytes were infected for 24 h at MOI 1 with HIV-1 (NLAD8 (R5)). They were added to the top chamber of transwells containing a hCMEC/D3 monolayer to allow transmigration to occur at the same time as cell-free HIV (NLAD8 (R5)) was added to the top chamber of transwells (at the same amount as it was added to monocytes) containing a hCMEC/D3 monolayer for infiltration to happen. After overnight incubation, RNA from the top chamber and the bottom chamber was extracted. The data represents relative HIV RNA level in the bottom chamber (normalized to the top chamber) obtained from individual measurements. The data were obtained from n = 2 donors performed in three technical replicates. (C) Schematic of the experimental setup and image representation of time-lapse imaging of primary human monocytes pre-stained with CellTrace (magenta) and exposed to HIV-1 Gag-imCherry (yellow) for 6 h prior to the beginning of the co-incubation of monocytes with a hESC-derived cortical organoid. For representation purposes HIV-1 Gag-imCherry is shown separately in gray scale in the second row. Images were taken every hour for 8 days. At day 0 of co-incubation, monocytes carrying HIV-1 particles show yellow dots (not visible at this resolution). At 18 hpi (corresponding to 0.5 days post-co-incubation, second panel), very few cells were productively infected. Starting from day 4 post co-incubation (panel 3) up until day 7 (panel 4), multiple cells were observed to be productively infected and penetrating inside the cerebral organoid. Scale bar: 50 μm. Full videos can be found in Movie EV5 and EV6. This observation is supported by the graph with a pixel sum from a field of view of HIV-1 Gag-imCherry channel showing that pixel sum increases drastically at around 4 days (90–100 h) post co-incubation. (D) 3D reconstruction of an immunofluorescent image of a brain organoid with non-infected primary monocytes. Monocyte-derived cells are stained with Iba1 (magenta), astrocytes with GFAP (cyan), and cell nuclei with DAPI (yellow). Scale bar: 30 μm. (E) Three-dimensional reconstruction of an immunofluorescence image of a hESC-derived cortical organoid infiltrated with primary monocytes (CellTrace, magenta), infected with HIV-1 Gag-imCherry particles (cyan) for 7 days after the beginning of co-incubation (as in A). Astrocytes are stained with GFAP (yellow) and cell nuclei with DAPI (blue). Scale bar: 15 μm. The infected monocyte highlighted in the white square is magnified in (i). Scale bar: 5 μm. (F–H) Transmigration of primary monocytes exposed to HIV-1 R5 Gag-imCherry for 24 h, washed and pre-incubated with OCLN-derived peptides for 1 h. Monocytes were added at the top of a transwell with a confluent hCMEC/D3 monolayer and transmigration was allowed to happen overnight (≈16 h). (F) Schematic of the experimental setup. (G) Ratio of the amount of HIV RNA in the supernatant of the lower chamber was divided by the amount measured in the upper chamber. Each dot represents the ratio of the HIV RNA measurement performed in duplicate from a transwell containing a single organoid. The data represents were obtained from n = 4 individual experiments. Each dot represents a biological replicate (varies between conditions). Data normalized to DMSO of each experiment. (H) Ratio of the amount of HIV RNA in the organoid of the lower chamber was divided by the amount measured in the upper chamber. Each dot represents the ratio of the HIV RNA measurement performed in duplicate from a transwell containing a single organoid. Each dot represents a biological replicate (varies between conditions). Data normalized to DMSO of each experiment. Data information: In (A), the mean is represented with a black line and the normalization to non-infected (fold-change of 1) is marked by a red dotted line. In (B, G, H), the data are presented as mean ± SEM. Two-tailed Student’s t-test p value < 0.01 (**) and when not specified between conditions, the difference in not significant. Source data are available online for this figure. |

Characterization of monocytic Occludin expression. (A) Schematic representation of a CRISPR/Cas9 lentiviral construct used for the generation of OCLN KO THP-1 cells with indicated target sequences. (B) Western Blot analysis of OCLN expression in indicated cell lines. Actin is used as a loading control. The hCMEC/D3 and THP-1 cells express OCLN (two bands), the THP-1 OCLN KO cells do not show OCLN, although non-specific bands of lower size and very weak intensity can be observed. As controls, NIH 3T3 do not express OCLN and THP-1 WT transduced with EGFP-OCLN express both endogenous and overexpressed OCLN. (C) Western Blot analysis of OCLN expression in THP-1 OCLN KO cells. GAPDH is used as a loading control. EGFP-OCLN can be seen with both anti-Occludin and anti-GFP antibody (green arrow at EGFP). EGFP-OCLN-ΔC and EGFP-CAAX can be seen with anti-GFP antibody only (red and yellow arrows, respectively). (D) Mean fluorescence intensity of EGFP-CAAX, EGFP-OCLN, or EGFP-OCLN-ΔC expressed by THP-1 OCLN KO cells measured by flow cytometry. The data were normalized to EGFP-CAAX obtained from n = 3 individual experiments. Each symbol’s color corresponds to an individual experiment. (E) Western Blot showing endogenous OCLN expression in human primary monocytes and exogenous expression of EGFP-OCLN in the same donors (2 donors). GAPDH is used as a loading control. (F) Immunofluorescence images of primary monocytes transduced with EGFP-OCLN, EGFP-CAAX, or non-transduced, fixed and stained with anti-OCLN antibody (cyan) and DAPI (yellow). EGFP is in magenta. Scale bar: 2 μm. (G) Efficiency of transduction of primary monocytes from 2 donors performed in two technical replicates measured by flow cytometry. (H) Mean fluorescence intensity of EGFP-CAAX, EGFP-OCLN or EGFP-OCLN-ΔC expressed by primary monocytes. The data were obtained from n = 6 monocyte donors normalized to EGFP-CAAX of each experiment. Each symbol’s color corresponds to an individual monocyte donor. In (D, G, H), the data are presented as mean ± SEM. Source data are available online for this figure. |

Characterization of the OCLN-containing compartment. (A–C) Immunofluorescence image of primary monocytes expressing either EGFP-OCLN or EGFP-CAAX (magenta) attached to hCMEC/D3 cells and stained with DAPI (yellow) and antibodies (cyan) against Rab11 (A), Rab13 (B), or Rab7 (C). Scale bar: 1 μm, except in C for EGFP-CAAX: 2 μm. (D) Primary monocyte expressing EGFP-OCLN (magenta) attached to hCMEC/D3 monolayer were incubated with 3 kDa fluorescent Dextran (cyan) and immediately imaged using confocal microscopy. The snapshots highlight that Dextran does not access the OCLN-containing compartment. Scale bar: 1 μm. Data information: In (A–C), data are presented as mean ± SEM. Two-tailed Student’s t-test p value < 0.001 (***) or non-significant (ns). Source data are available online for this figure. |

Monocytic OCLN transiently polarizes at monocyte-endothelial interaction sites during transmigration. (A, B) 3D time-lapse spinning disk confocal microscopy of transmigrating monocytes as in Fig. 1E, F. (A) Imaging of a primary monocyte transduced with EGFP-CAAX on hCMEC/D3 monolayer. Images were taken every 10 min. Scale bar: 10 μm. Full video can be found in Movie EV3. (B) Imaging of a primary monocyte transduced with EGFP-OCLN-ΔC on hCMEC/D3 monolayer. Images were taken every 10 min. Scale bar: 10 μm. Full video can be found in Movie EV4. Source data are available online for this figure. |
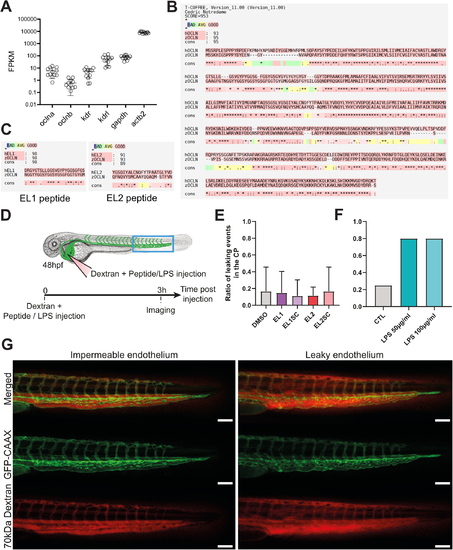
Characterization of the zebrafish embryo model. (A) OCLN-expressing RNA for oclna and oclnb paralogues assessed in the endothelium of Tg(fli:egfp) zebrafish embryos from (Bonkhofer et al, 2019). Kdr, kdrl, gapdh, and actb2 genes were used as housekeeping genes. (B) Comparative analysis of the human OCLN (hOCLN) and danio rerio (zebrafish) OCLN (zOCLN) amino acid sequences and consensus sequence using T-Coffee (see Methods for details). Red underlining of amino acids indicates good sequence similarity. (C) Comparative analysis of the EL1- and EL2-derived sequences of hOCLN with zOCLN. Red underlining of amino acids indicates good sequence similarity. (D) Schematic of the experimental procedure associated with the zebrafish model to test the effect of EL1, EL2 and their scramble peptides on endothelial permeability. Treatment with LPS is used as control for permeability inducing agents. (E) Bar graph of the ratio of leaky endothelium at 3 h post dextran and peptide injection. The experiment was carried out three independent times (nDMSO = 39; nEL1 = 25; nscEL1 = 26; nEL2 = 24; nscEL2 = 23). (F) Bar graph of the ratio of leaky endothelium at 3 h post dextran and peptide injection. The experiment was carried out one time. (nControl = 12; nLPS-50µg/mL = 15; nLPS-100µg/mL = 15). (G) Representative images of zebrafish embryos with an impermeable or leaky endothelium in the tail at 3 h post injection of PBS or LPS, respectively. Scale bar: 100 µm. Data information: In (A, D, E), data are presented as mean ± SD. |

Characterization of primary monocyte infection by HIV-1 and transmigration. (A) Primary monocytes were non-infected or infected with HIV-1 (NLAD8) at MOI 1 for 48 h in the presence or absence of 10 µM AZT. The dot plots show the percentage of Gag-iGFP-expressing cells as a function of the side scatter (SSC) measurement as determined by flow cytometry. The data highlights that despite AZT treatment, monocytes are positive for Gag-iGFP as they carry fluorescent particles. (B) Primary monocytes were non-infected, infected with HIV-1 Gag-iGFP, or HIV-1 Gag-iGFP pseudotyped with VSV-G, at MOI 1 for 48 h in the presence or absence of AZT. Cells were fixed and stained for Gag p17 (red) and DAPI (blue) and Gag-iGFP is shown in green. Scale bar: 5 µm. |