
|
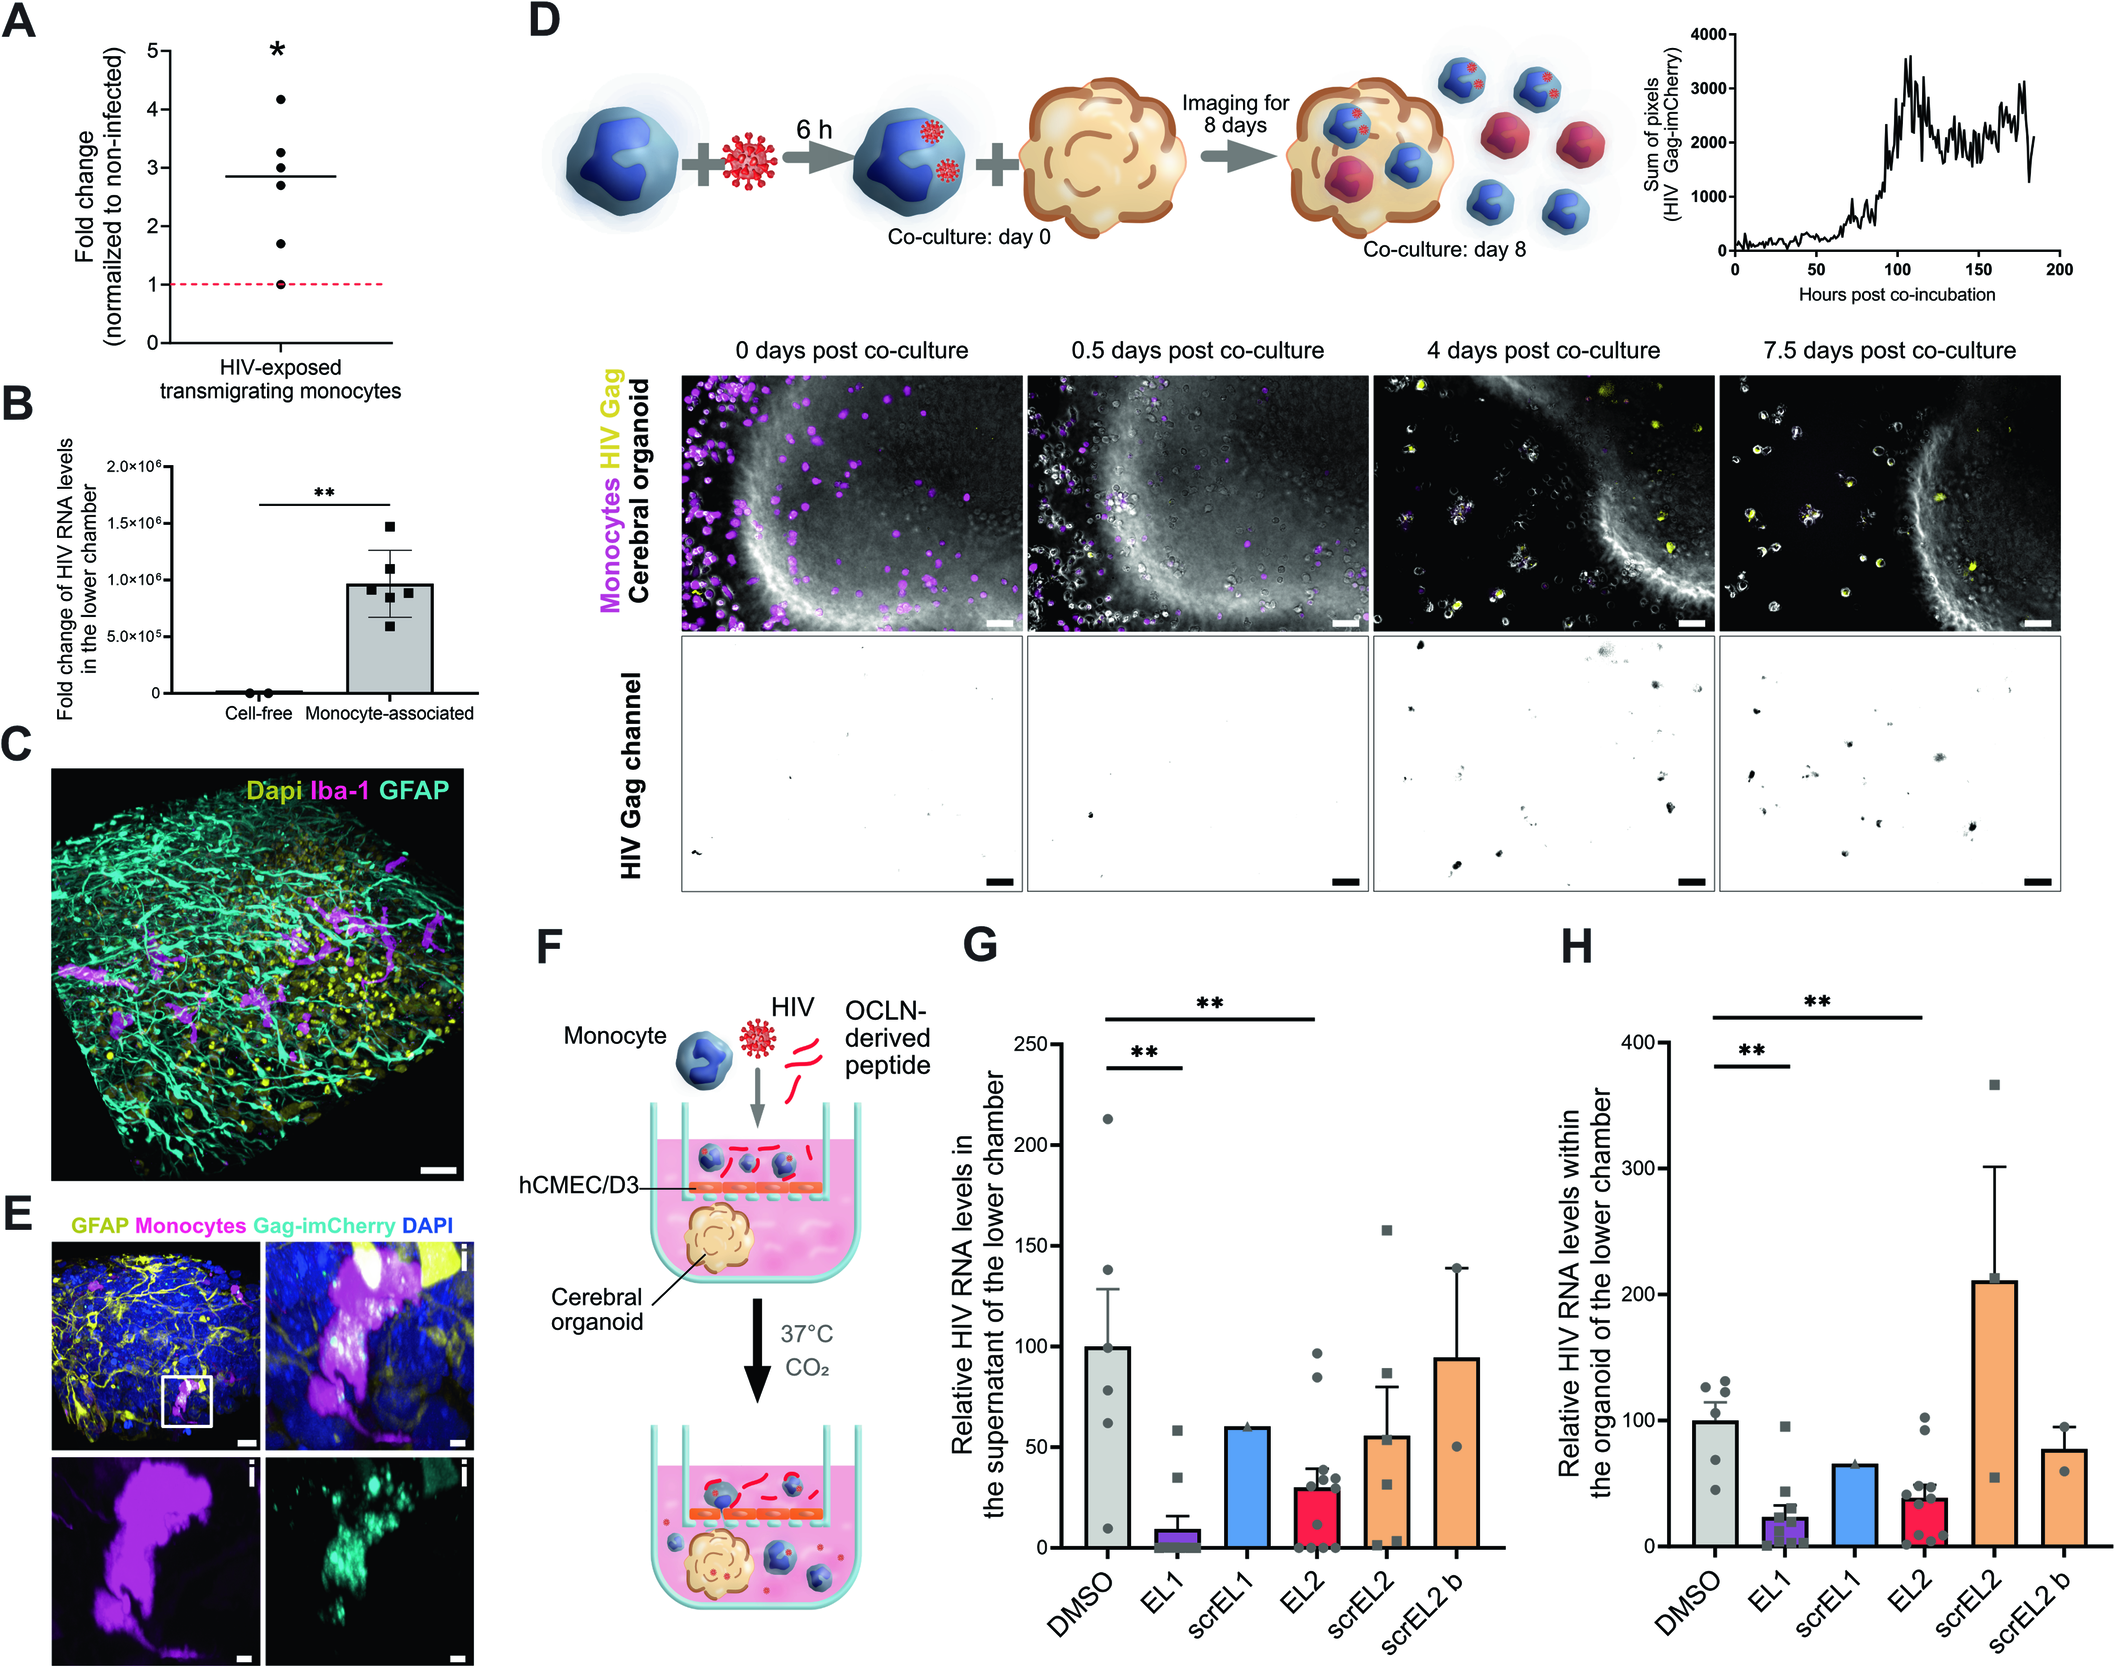
Fig. 4 OCLN-derived EL2 peptide inhibits HIV-1 neuroinvasion. (A) Primary monocytes were infected for 48 h at MOI 1 with HIV-1 (NLAD8) and added to the top chamber of transwells containing a hCMEC/D3 monolayer to allow transmigration to occur. After overnight incubation, the bottom chamber was harvested and the number of transmigrated monocytes was counted. The dot plot shows the mean of the fold change of the number of HIV-exposed monocytes over non-infected counterparts. Each dot corresponds to a donor. (B) Primary monocytes were infected for 24 h at MOI 1 with HIV-1 (NLAD8 (R5)). They were added to the top chamber of transwells containing a hCMEC/D3 monolayer to allow transmigration to occur at the same time as cell-free HIV (NLAD8 (R5)) was added to the top chamber of transwells (at the same amount as it was added to monocytes) containing a hCMEC/D3 monolayer for infiltration to happen. After overnight incubation, RNA from the top chamber and the bottom chamber was extracted. The data represents relative HIV RNA level in the bottom chamber (normalized to the top chamber) obtained from individual measurements. The data were obtained from n = 2 donors performed in three technical replicates. (C) Schematic of the experimental setup and image representation of time-lapse imaging of primary human monocytes pre-stained with CellTrace (magenta) and exposed to HIV-1 Gag-imCherry (yellow) for 6 h prior to the beginning of the co-incubation of monocytes with a hESC-derived cortical organoid. For representation purposes HIV-1 Gag-imCherry is shown separately in gray scale in the second row. Images were taken every hour for 8 days. At day 0 of co-incubation, monocytes carrying HIV-1 particles show yellow dots (not visible at this resolution). At 18 hpi (corresponding to 0.5 days post-co-incubation, second panel), very few cells were productively infected. Starting from day 4 post co-incubation (panel 3) up until day 7 (panel 4), multiple cells were observed to be productively infected and penetrating inside the cerebral organoid. Scale bar: 50 μm. Full videos can be found in Movie EV5 and EV6. This observation is supported by the graph with a pixel sum from a field of view of HIV-1 Gag-imCherry channel showing that pixel sum increases drastically at around 4 days (90–100 h) post co-incubation. (D) 3D reconstruction of an immunofluorescent image of a brain organoid with non-infected primary monocytes. Monocyte-derived cells are stained with Iba1 (magenta), astrocytes with GFAP (cyan), and cell nuclei with DAPI (yellow). Scale bar: 30 μm. (E) Three-dimensional reconstruction of an immunofluorescence image of a hESC-derived cortical organoid infiltrated with primary monocytes (CellTrace, magenta), infected with HIV-1 Gag-imCherry particles (cyan) for 7 days after the beginning of co-incubation (as in A). Astrocytes are stained with GFAP (yellow) and cell nuclei with DAPI (blue). Scale bar: 15 μm. The infected monocyte highlighted in the white square is magnified in (i). Scale bar: 5 μm. (F–H) Transmigration of primary monocytes exposed to HIV-1 R5 Gag-imCherry for 24 h, washed and pre-incubated with OCLN-derived peptides for 1 h. Monocytes were added at the top of a transwell with a confluent hCMEC/D3 monolayer and transmigration was allowed to happen overnight (≈16 h). (F) Schematic of the experimental setup. (G) Ratio of the amount of HIV RNA in the supernatant of the lower chamber was divided by the amount measured in the upper chamber. Each dot represents the ratio of the HIV RNA measurement performed in duplicate from a transwell containing a single organoid. The data represents were obtained from n = 4 individual experiments. Each dot represents a biological replicate (varies between conditions). Data normalized to DMSO of each experiment. (H) Ratio of the amount of HIV RNA in the organoid of the lower chamber was divided by the amount measured in the upper chamber. Each dot represents the ratio of the HIV RNA measurement performed in duplicate from a transwell containing a single organoid. Each dot represents a biological replicate (varies between conditions). Data normalized to DMSO of each experiment. Data information: In (A), the mean is represented with a black line and the normalization to non-infected (fold-change of 1) is marked by a red dotted line. In (B, G, H), the data are presented as mean ± SEM. Two-tailed Student’s t-test p value < 0.01 (**) and when not specified between conditions, the difference in not significant. Source data are available online for this figure.