
Fig. 1
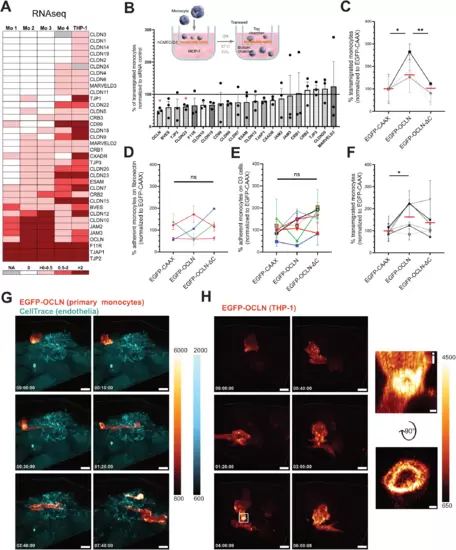
Monocytic OCLN favors monocyte transmigration across the BBB-like endothelium. (A) Heatmap of TJAP-coding mRNAs in human primary monocytes and the THP-1 cell line based on existing RNAseq databases (see Methods). (B) siRNA screen on monocytic TJAP proteins to define their role in transmigration. The scheme represents the experimental setup of a transmigration assay with monocytes crossing a confluent monolayer of brain endothelial cells (hCMEC/D3). TJAPs were selected based on the heatmap shown in A. THP-1 cells were electroporated with the indicated siRNAs and added to the top chamber for 17 h (overnight). The data is presented as percentage of transmigrated THP-1 cells normalized to the siRNA control (black line). The graph shows n = 3 independent experiments performed at least in two technical replicates. (C) Percentage of transmigrated OCLN KO THP-1 cells rescued either with EGFP-CAAX, EGFP-OCLN, or EGFP-OCLN-ΔC across hCMEC/D3 monolayer. The data were obtained from n = 3 individual experiments performed in two technical replicates normalized to EGFP-CAAX of each experiment. Each symbol’s color corresponds to an individual experiment. Red dashes represent the mean of experiments combined together. (D) Percentage of adherent primary monocytes expressing EGFP-CAAX, EGFP-OCLN, or EGFP-OCLN-ΔC on fibronectin substrate measured by flow cytometry. Adhesion time is 30 min. The data were obtained from n = 4 monocyte donors. Data were normalized to the average of EGFP-CAAX obtained from each experiment. Each symbol’s color corresponds to an individual monocyte donor. (E) Percentage of adherent primary monocytes expressing EGFP-CAAX, EGFP-OCLN, or EGFP-OCLN-ΔC on hCMEC/D3 monolayer measured by flow cytometry. Adhesion time is 30 min. The data represents the mean values obtained from n = 7 monocyte donors. Data were normalized to the average of EGFP-CAAX obtained from each experiment. Each symbol’s color corresponds to an individual monocyte donor. Error bars are SEM. (F) Percentage of transmigrated primary monocytes expressing EGFP-CAAX, EGFP-OCLN, or EGFP-OCLN-ΔC across hCMEC/D3 monolayer. The data were obtained from n = 6 monocyte donors. Data were normalized to the average of EGFP-CAAX obtained from each experiment. Each symbol’s color corresponds to an individual monocyte donor. (G, H) 3D time-lapse spinning disk confocal microscopy of transmigrating monocytes. Fluorescence intensity scale is shown on the side of each panel. EGFP is represented using the “red Fire” color-coding, and endothelial cells are stained with a CellTrace marker (cyan) added prior to the addition of the monocytes. Timescales are shown is the bottom right corner and correspond to the time after which imaging acquisition started. (G) Imaging of a primary monocyte transduced with EGFP-OCLN on hCMEC/D3 monolayer. Images were taken every 10 min. Scale bar: 10 μm. Full video can be found in Movie EV1. (H) Imaging of a THP-1 cell transduced with EGFP-OCLN on hCMEC/D3 monolayer (not stained). Images were taken every 10 min. Scale bar: 8 μm. Full video can be found in Movie EV2. The white square highlights OCLN accumulation at the potential interface between hCMEC/D3 cells and the THP-1 cell. (i) Enlarged image from the white square and a 90° flip showing the accumulation of OCLN. Scale bar: 0.7 µm. Data information: In (B, C, F), data are presented as mean ± SEM. In (D, E), error bars represent SEM. Two-tailed Student’s t-test p value < 0.05 (*), < 0.01 (**) or non-significant (ns). Source data are available online for this figure. |