
- Title
-
Light wavelength modulates search behavior performance in zebrafish
- Authors
- Waalkes, M.R., Leathery, M., Peck, M., Barr, A., Cunill, A., Hageter, J., Horstick, E.J.
- Source
- Full text @ Sci. Rep.
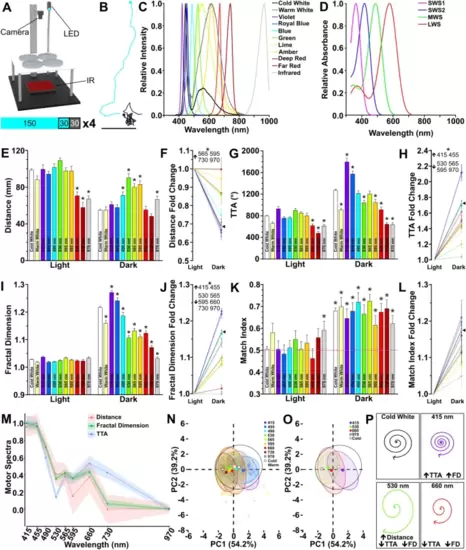
Light wavelength influences light search performance. (A) Behavior rig set-up shown with blue LED. Below: Light series used for recordings. Numbers shown are seconds. Blue signifies light ON periods while dark grey light OFF. Black outlines indicate active recording periods. Recording series was repeated 4 times (× 4) with a 150 s inter-trial interval with the respective light ON. (B) Example tracks seen in zebrafish during the light ON (blue) and after the loss of light (black). Scale bar 20 mm. (C) Emission spectra of 11 LED lights used for experiments. (D) Absorbance spectra of the four cone opsins in the larval zebrafish retina. (E–J) Quantification of distance (E, F), total turn angle (TTA) (G–H), and fractal dimension (I–J) during light and dark recording periods. Wavelength indicated on bars. Data is generated using the average across all four trials. (E, G, and I) show magnitude of different motor responses, whereas (F, H, J) show that change during the light to dark transition. Asterisk indicates p ≤ 0.05 compared to cold white light responses during baseline or dark periods. (K–L) Quantification of motor asymmetry magnitude (K) and transition (L). Circled asterisk indicates p ≤ 0.05 from 0.5 (random). Asterisk for all fold change figures show p ≤ 0.05 change that is greater than (up arrow) or less than (down arrow) cold white light controls. Individual wavelengths indicated next to arrow. (M) Motor spectra calculated using normalized fold change data for distance, fractal dimension, and TTA across all tested single wavelength lights. (N) Individual PCA plots for each wavelength based on fold change data for fractal dimension, distance, and TTA. Ellipses surround 90% of data points for each wavelength tested. Opaque colored circles represent the centroid plotted for each ellipse. (O) As in L, but subset 415 nm, 530 nm, 660 nm, 970 nm, and cold white light wavelengths. Percentages on axes represent variance of each principal component. (P) Schematic demonstrating how wavelengths selected for ongoing analysis impact local search performance. N’s: cold white light = 564, warm white light = 59, 415 nm = 64, 455 nm = 64, 490 nm = 68, 530 nm = 62, 565 nm = 77, 595 nm = 59, 660 nm = 59, 730 nm = 54, 970 nm = 65. In all figures error bars, or envelope in M, show standard error of the mean (SEM). |
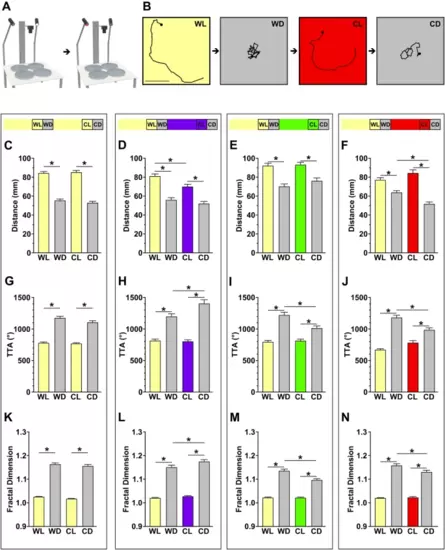
Distinct wavelengths can acutely modulate local search performance. (A) Behavior rig set-up with cold white and chromatic LEDs. (B) Representative traces for each recording period showing a red light example (WL: white light, WD: white to dark period, CL: color light, CD: color to dark period). Scale bar 20 mm. (C-N) Quantification of local search motor parameters across recording periods. (C–F) Distance, (G–J) TTA, and (K–N) fractal dimension showing white light, 415 nm, 530 nm, and 660 nm from left to right (color coded). The light series are above each column shows the lighting series and wavelength (color coded) for each experiment. Asterisks indicates p ≤ 0.05 between photoperiods designated. N’s: cold white light = 175, 415 nm = 94, 530 nm = 92, 660 nm = 102. |
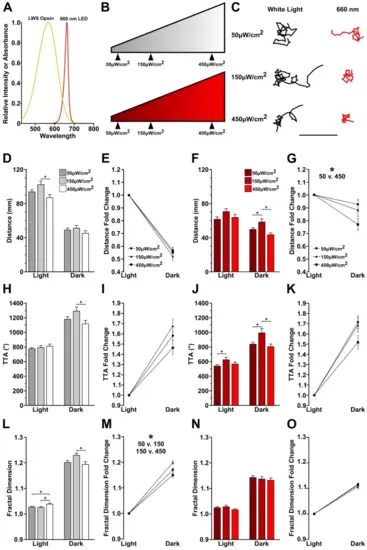
Long wavelength light modulates behavior independently of intensity. (A) Diagram of relative absorbance of the long wavelength stimulating (LWS) opsin and emission spectra of the 660 nm LED. (B) Schematic of tested cold white and 660 nm light intensities. (C) Representative traces of individual larvae following the loss of illumination. Traces show 30 s following the loss of light. Scale bar 20 mm. (D–O) Quantification of motor metric changes at varying light intensities. N’s: cold white light 50 µW/cm2 = 174, 150 µW/cm2 = 72, 450 µW/cm2 = 73; 660 nm at 50 µW/cm2 = 161, 150 µW/cm2 = 81, 450 µW/cm2 = 82. Asterisks indicates p ≤ 0.05 between designated intensities. |
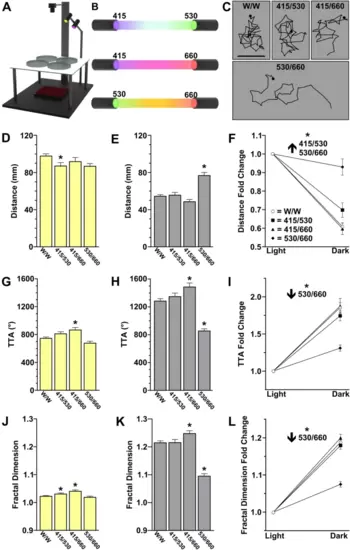
Exposure to two chromatic wavelengths recapitulates white light behavior. (A) Behavior rig set up for two LED experiment. (B) Visualization of combined wavelengths. (C) Representative local search tracks for dual cold white light controls (W/W), combined 415/530 nm, combined 415/660 nm, and combined 530/660 nm light exposure. Scale bar 10 mm. (D–L) Quantification for the light ON (D, G, J) and OFF (E, H, K) responses and fold change between photoperiods (F, I, L) for each motor metric. Asterisks indicate p ≤ 0.05 from white light control. N’s: W/W = 215, 415/530 nm = 94, 415/660 nm = 80, 530/660 nm = 63. |
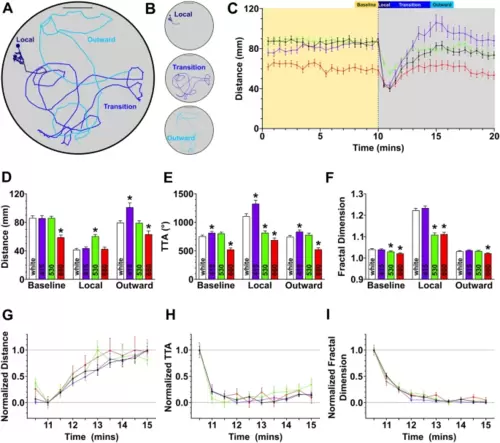
Locomotor modulations persist during outward search behavior. (A) Representative track highlighting the local (dark blue line), transitional (blue line), and outward (light blue line) periods. Scale bar 20 mm. (B) Isolated subsets of (A) showing local, transition, and outward motor paths. Scale bar 20 mm. (C) Time-course displaying the change in distance over time. Dotted vertical line at 10 min indicates the loss of illumination. Baseline, local, transition, and outward periods are defined above. (D–F) Quantification of distance (D), TTA (E), and fractal dimension (F) across baseline, local, and outward periods. Asterisk indicates p ≤ 0.05 from white light control within that period. (G–I) Normalized responses during the transition from local to outward search showing the rate of change during the first five minutes after the loss of light. N’s: cold white light = 74, 415 nm = 73, 530 nm = 80, 660 nm = 67. |
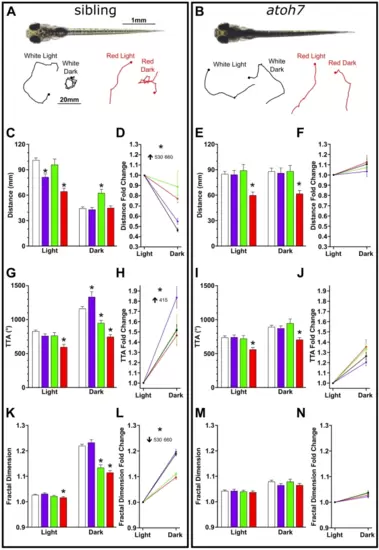
Long wavelengths modulate search behavior in blind larvae. (A, B) Representative image of 6 dpf sibling (+ /?) and homozygous atoh7 mutant (–/–). Below are illustrative path trajectories following the loss of light for each tested condition. C-N) Quantification of motor metrics for siblings (left) and mutants (right). Showing distance (C–F), TTA (G–J), and fractal dimension (K–N). Asterisks in bar graphs indicate p ≤ 0.05 to white light controls during that period (base or dark). For fold change line graphs asterisk shows p ≤ 0.05 to white light control where effected wavelength is indicated, and arrow shows direction of change. N’s: sibling cold white light = 142, 415 nm = 56, 530 nm = 50, 660 nm = 57; atoh7 white light = 114, 415 nm = 48, 530 nm = 36, 660 nm = 50. |