
Fig. 5
- ID
- ZDB-FIG-240718-11
- Publication
- Waalkes et al., 2024 - Light wavelength modulates search behavior performance in zebrafish
- Other Figures
- All Figure Page
- Back to All Figure Page
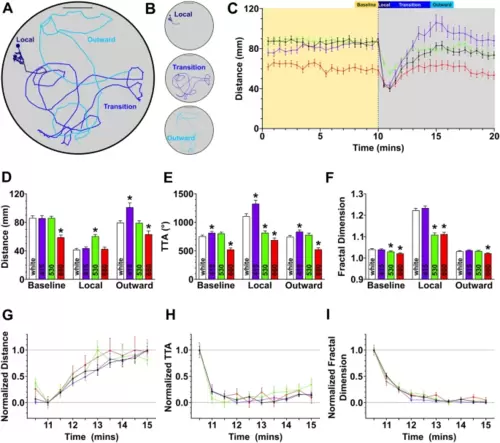
Locomotor modulations persist during outward search behavior. (A) Representative track highlighting the local (dark blue line), transitional (blue line), and outward (light blue line) periods. Scale bar 20 mm. (B) Isolated subsets of (A) showing local, transition, and outward motor paths. Scale bar 20 mm. (C) Time-course displaying the change in distance over time. Dotted vertical line at 10 min indicates the loss of illumination. Baseline, local, transition, and outward periods are defined above. (D–F) Quantification of distance (D), TTA (E), and fractal dimension (F) across baseline, local, and outward periods. Asterisk indicates p ≤ 0.05 from white light control within that period. (G–I) Normalized responses during the transition from local to outward search showing the rate of change during the first five minutes after the loss of light. N’s: cold white light = 74, 415 nm = 73, 530 nm = 80, 660 nm = 67. |