
Fig. 1
- ID
- ZDB-IMAGE-240718-7
- Publication
- Waalkes et al., 2024 - Light wavelength modulates search behavior performance in zebrafish
- All Figures
- Figures for Waalkes et al., 2024
|
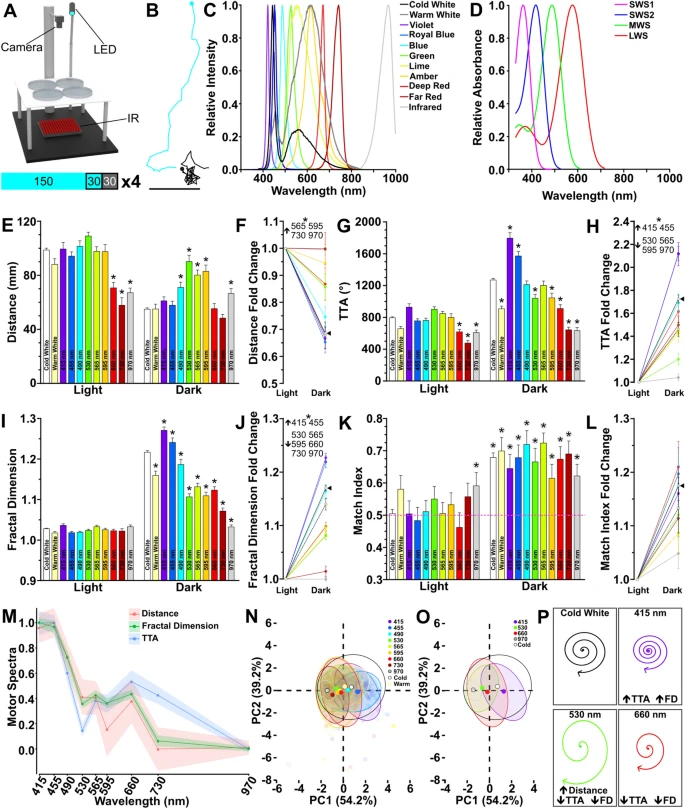
Fig. 1 Light wavelength influences light search performance. (A) Behavior rig set-up shown with blue LED. Below: Light series used for recordings. Numbers shown are seconds. Blue signifies light ON periods while dark grey light OFF. Black outlines indicate active recording periods. Recording series was repeated 4 times (× 4) with a 150 s inter-trial interval with the respective light ON. (B) Example tracks seen in zebrafish during the light ON (blue) and after the loss of light (black). Scale bar 20 mm. (C) Emission spectra of 11 LED lights used for experiments. (D) Absorbance spectra of the four cone opsins in the larval zebrafish retina. (E–J) Quantification of distance (E, F), total turn angle (TTA) (G–H), and fractal dimension (I–J) during light and dark recording periods. Wavelength indicated on bars. Data is generated using the average across all four trials. (E, G, and I) show magnitude of different motor responses, whereas (F, H, J) show that change during the light to dark transition. Asterisk indicates p ≤ 0.05 compared to cold white light responses during baseline or dark periods. (K–L) Quantification of motor asymmetry magnitude (K) and transition (L). Circled asterisk indicates p ≤ 0.05 from 0.5 (random). Asterisk for all fold change figures show p ≤ 0.05 change that is greater than (up arrow) or less than (down arrow) cold white light controls. Individual wavelengths indicated next to arrow. (M) Motor spectra calculated using normalized fold change data for distance, fractal dimension, and TTA across all tested single wavelength lights. (N) Individual PCA plots for each wavelength based on fold change data for fractal dimension, distance, and TTA. Ellipses surround 90% of data points for each wavelength tested. Opaque colored circles represent the centroid plotted for each ellipse. (O) As in L, but subset 415 nm, 530 nm, 660 nm, 970 nm, and cold white light wavelengths. Percentages on axes represent variance of each principal component. (P) Schematic demonstrating how wavelengths selected for ongoing analysis impact local search performance. N’s: cold white light = 564, warm white light = 59, 415 nm = 64, 455 nm = 64, 490 nm = 68, 530 nm = 62, 565 nm = 77, 595 nm = 59, 660 nm = 59, 730 nm = 54, 970 nm = 65. In all figures error bars, or envelope in M, show standard error of the mean (SEM).