
Fig. 3
- ID
- ZDB-IMAGE-240718-9
- Publication
- Waalkes et al., 2024 - Light wavelength modulates search behavior performance in zebrafish
- All Figures
- Figures for Waalkes et al., 2024
|
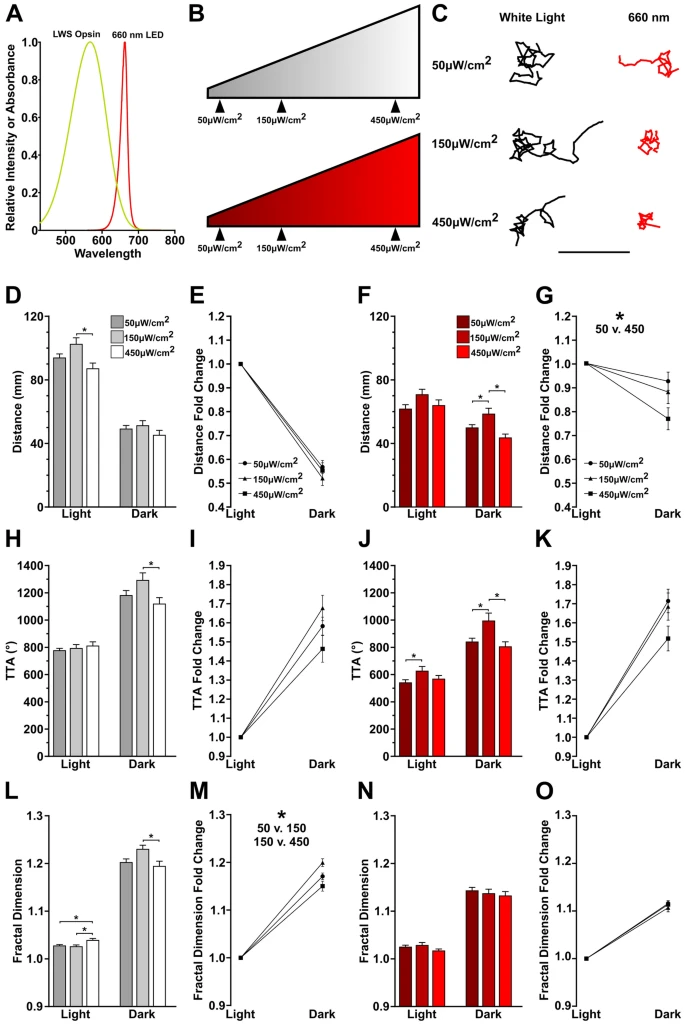
Fig. 3 Long wavelength light modulates behavior independently of intensity. (A) Diagram of relative absorbance of the long wavelength stimulating (LWS) opsin and emission spectra of the 660 nm LED. (B) Schematic of tested cold white and 660 nm light intensities. (C) Representative traces of individual larvae following the loss of illumination. Traces show 30 s following the loss of light. Scale bar 20 mm. (D–O) Quantification of motor metric changes at varying light intensities. N’s: cold white light 50 µW/cm2 = 174, 150 µW/cm2 = 72, 450 µW/cm2 = 73; 660 nm at 50 µW/cm2 = 161, 150 µW/cm2 = 81, 450 µW/cm2 = 82. Asterisks indicates p ≤ 0.05 between designated intensities.