
- Title
-
Mitochondrial Fission Is Involved in Heat Resistance in Zebrafish
- Authors
- Mao, Y., Hong, K., Li, L., Nam, I.K., Kim, S.H., Choe, S.K.
- Source
- Full text @ Zebrafish
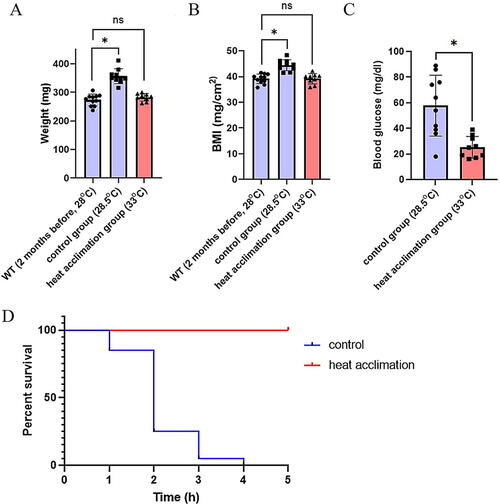
Heat acclimation causes physiological changes in zebrafish. (A) Average body weight. (B) Average BMI before and after treatment. (C) The average blood glucose levels of two groups of zebrafish. (A–C) n ≥ 9 per group, repeat = 3. *indicates p < 0.05, and ns indicates p > 0.05. (A–C) WT zebrafish were maintained in a conventional system at 28°C, whereas the control and the heat acclimation groups were kept in separate fish tanks in water baths at 28°C and 33°C, respectively. (D) Adult zebrafish heat tolerance test at 39°C. The representative survival curve was drawn using the GraphPad Prism 8 software. n = 20 per experiment, repeat = 2. BMI, body mass index; WT, wild type. |
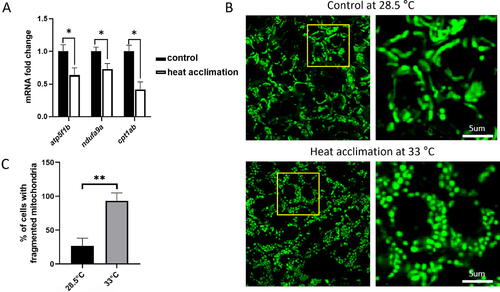
Heat acclimation reduces the expression of functional mitochondrial genes and induces mitochondrial fission. (A) Expression levels of genes related to mitochondrial function (atp5f1b, ndufa9a, and cpt1ab) in the liver were quantified and graphed. n ≥ 7 per experiment, repeat = 2. *indicates p < 0.05. (B) Representative images of liver mitochondrial morphology after 2 months of heat stress at 33°C. Scale bar = 5 µm. (C) Percentile of cells with fragmented mitochondria. **indicates p < 0.01. |

Fasting increases heat resistance and induces mitochondrial fission in adult zebrafish. (A) Representative images of zebrafish liver mitochondrial morphology after the indicated treatment. The fast group was not fed for 2 days; 0.5 mM CQ was treated for two days. Scale bar = 5 µm. (B) Percentile of cells with fragmented mitochondria. **indicates p < 0.01. (C) Survival rate of the indicated three groups to heat tolerance test. n = 20 per experiment, repeat = 3. Statistical significance was determined between the fed and the fast groups, and between the fast and the fast + CQ groups as indicated. *indicates p < 0.05. CQ, chloroquine. |

Short-term heat acclimation induces mitochondrial fission and promotes heat resistance in zebrafish embryos. (A–C) Short-term heat acclimation experiment at 33°C. (A) Survival rate in each group of embryos was determined after the indicated period of heat acclimation. n = 100, repeat = 3. *indicates p < 0.05, and ns indicates p > 0.05. (B) Survival rates of the heat acclimation groups subjected to heat tolerance test at 39°C. n = 50 per experiment, repeat = 3. Statistical significance was determined between the control and the experimental groups, and the result was indicated above the experimental group. *indicates p < 0.05. (C) Representative images of liver mitochondrial morphology at 4 dpf in the heat acclimation groups as indicated. Scale bar = 5 µm. (D) Representative images of liver mitochondrial morphology in the indicated groups at 4 dpf. Scale bar = 5 µm. (E) Survival rate of embryos tested for heat tolerance in the indicated groups. n = 50 per experiment, repeat = 3. Statistical significance was determined between the control and the heat acclimation groups, and between the heat acclimation and the heat acclimation + Mdivi-1 groups as indicated. *indicates p < 0.05 and ns indicates p > 0.05. dpf, days postfertilization. |