
- Title
-
Lens autophagy protein ATG16L1: a potential target for cataract treatment
- Authors
- Cui, Y., Yu, X., Bao, J., Ping, X., Shi, S., Huang, Y., Yin, Q., Yang, H., Chen, R., Yao, K., Chen, X., Shentu, X.
- Source
- Full text @ Theranostics
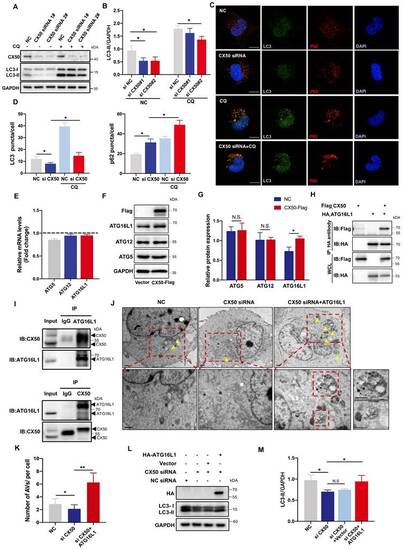
ATG16L1 is crucial for lens autophagy induced by CX50. (A) Western blot analysis of LC3-I/II and CX50 in NC or CX50-knockdown HLE cells treated with or without 30 µM CQ for 6 h. (B) Quantification of LC3 levels, n = 3. Mann-Whitney test. (C) Representative images of LC3 and p62 puncta in NC and CX50-knockdown HLE cells treated with or without CQ (n = 3, > 30 cells per experiment), scale bar: 10 µm. (D) Quantification of LC3 and p62 puncta per cell, n = 3, > 30 cells per experiment (Mann-Whitney test). (E-G) mRNA(E) and protein levels (F and G) of ATG5, ATG12, and ATG16L1 in CX50 over-expressing HLE cells. (H) Immunoblot of Co-IP from Flag-CX50 with HA-ATG16L1 in HEK293T cells. WCL: whole cell lysis. (I) IP analysis of the interaction between CX50 and ATG16L1 in HLE cells. (J) Electron micrographs of HLE cells and (K) quantification of the AVs per cell. Yellow arrows indicate autophagic vacuoles (AVs). ≥ 8 cells per experiment (Student's t-test analysis), scale bar: 1 µm. (L) Western blot analysis of LC3-II and HA in NC or CX50-knockdown HLE cells transfected with vector or ATG16L1. (M) Quantification analysis of LC3 levels, n = 3. Mean ± SD, *p < 0.05, **p < 0.01. N.S. not significant (Mann-Whitney test). |
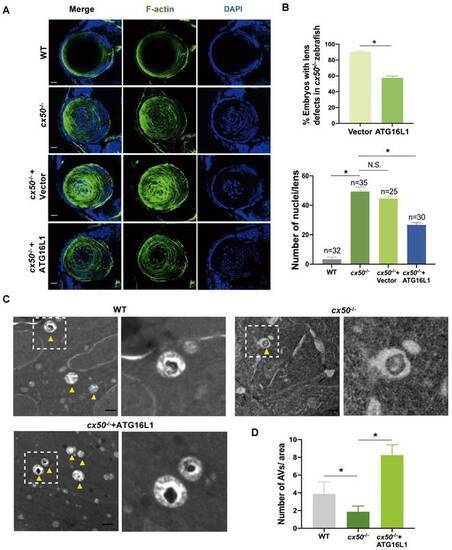
ATG16L1 effectively relieves lens differentiation defects in cx50-deficient zebrafish. (A) Representative images show the distribution of nuclei and F-actin in the lenses of 72 hpf WT, cx50-deficient zebrafish, and cx50-deficient zebrafish injected with the vector or ATG16L1 plasmid. Scale bar: 10 µm. (B) Quantification of the severity of lens defects and the number of nuclei in lenses of each group (n > 25 zebrafish for each group). Mann-Whitney test. (C) Electron micrographs of lenses in 72 hpf WT, cx50-deficient zebrafish, and cx50-deficient zebrafish injected with the ATG16L1 plasmid. Yellow arrows indicate autophagic vacuoles (AVs), scale bar: 1 µm. (D) The number of AVs per area (40 μm2) in each group (n ≥ 30 cells from 5 lenses). Mean ± SD, *p < 0.05. N.S. not significant (Mann-Whitney test). |
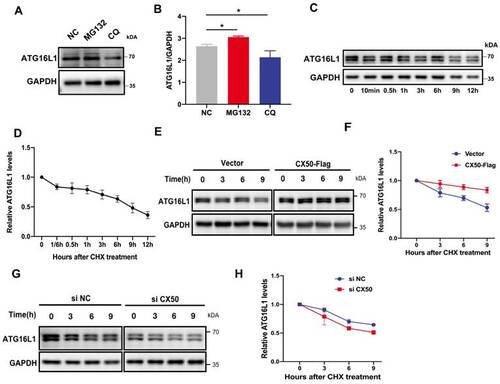
ATG16L1 is mainly degraded by the ubiquitin-proteasome system. (A) HLE cells were treated with 10 µM MG132 or 30 µM CQ for 6 h, and Western blotting was performed. (B) Quantification of LC3 levels, n = 3, *p < 0.05 (Mann-Whitney test). (C) HLE cells were treated with 30 µg/ml CHX for the indicated time, and the ATG16L1 expression was detected by Western blotting, n = 3. (D) ATG16L1 expression relative to GAPDH was quantified. (E) CX50-overexpressing HLE cells or (G) CX50-knockdown HLE cells were treated with 30 µM CHX for different times and (F and H) quantification of the ATG16L1 expression levels normalized to the GAPDH, n = 3, mean ± SD. |
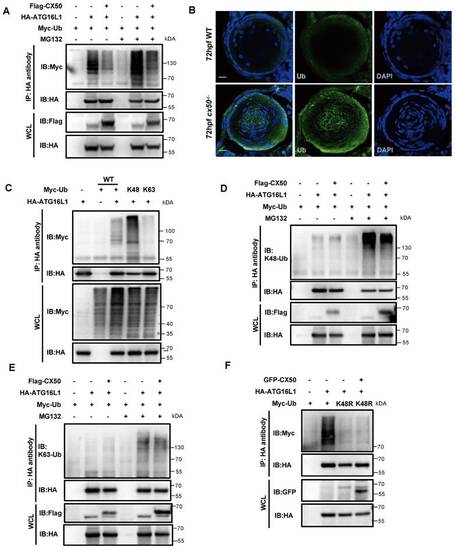
K48-linked ubiquitination of ATG16L1 is mediated by CX50. (A) HEK293 cells were transfected with HA-ATG16L1 or Myc-Ub with or without Flag-CX50. After 24 h transfection, IP was performed with HA affinity gels on cells with or without MG132 treatment for 6 h, and ubiquitination was analyzed using anti-Myc. WCL: whole cell lysis. (B) Representative images showing the distribution of ATG16L1 and Ub in lenses from 72 hpf WT and cx50-deficient zebrafish. Scale bar: 10 µm. (C-F) The HEK293 cells were transfected with indicated plasmids for 24 h, and the IP using HA affinity gels was subjected to immunoblotting using the indicated antibodies. |
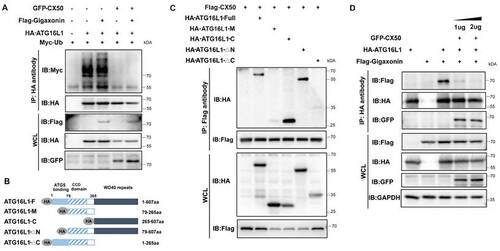
The interaction between ATG16L1 and E3 ubiquitin ligase gigaxonin is weakened by CX50 overexpression. (A) HEK293 cells were transfected with indicated plasmids, and IP was analyzed with HA affinity gels and Western blotting. (B) ATG16L1 deletion constructs. (C) Immunoblots of immunoprecipitates from CX50-Flag with Atg16L1-HA, ATG16L1-M, ATG16L1-C, ATG16L1-△N, and ATG16L1-△C in HEK293T cells. WCL: whole cell lysis. (D) HEK293 cells were transfected with CX50-GFP, ATG16L1-HA, or gigaxonin-Flag for 24 h. ATG16L1-HA was then immunoprecipitated by anti-HA, and the associated gigaxonin and ATG16L1 were analyzed by Western blotting. |

Identification of Riboflavin, a potential ATG16L1 ubiquitination regulator. (A) Modeling of riboflavin docking superimposed on gigaxonin, with the interacting gigaxonin amino acids represented by green sticks. (B) Cellular thermal shift assay of gigaxonin with riboflavin. (C) gigaxonin melting curves, n = 3. (D-E) HEK293 cells were transfected with indicated plasmids for 24 h; then, the cells were treated with DMSO or riboflavin for another 24 h. Western blots of immunoprecipitates with HA affinity gels. (F) Western blots of ATG16L1, LC3, and p62 protein levels in HLE cells treated with DMSO or riboflavin (40 µM and 80 µM), n = 3. (G-I) Quantification of ATG16L1, LC3, and p62 levels, n = 3 (Mann-Whitney test). (J-K) Electron micrographs of HLE cells and quantification of AVs per cell. Yellow arrows indicate autophagic vacuoles. ≥ 8 cells per experiment, scale bar: 1 µm. Mean ± SD, *p < 0.05, **p < 0.01(Mann-Whitney test). |
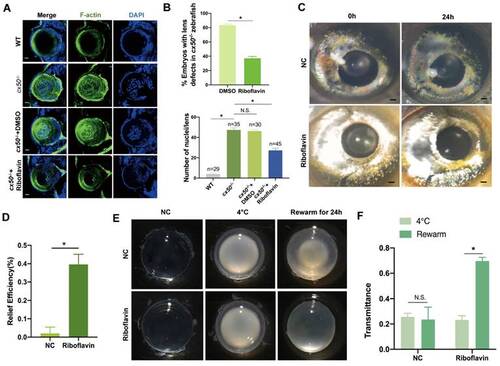
Riboflavin alleviates lens opacity in autophagy-related cataract models. (A) Representative images show the distribution of nuclei and F-actin in the lens of 72 hpf WT, cx50-deficient zebrafish, and cx50-deficient zebrafish treated with DMSO or riboflavin (80 µM). Scale bar: 10 µm. (B) Quantification of the severity of lens defects and the number of nuclei in lenses of each group (n > 25 zebrafish for each group) (Mann-Whitney test). (C) Representative images show that riboflavin alleviates lens opacity in the H2O2-induced cataract zebrafish model (n > 6 for each group). (D) Quantification of relief efficiency (Mann-Whitney test). (E) Representative images show that riboflavin could relieve cataract phenotype in cold-induced cataract rat models. (F) Quantification of transmittance (n > 5 for each group). Mean ± SD, *p < 0.05. N.S. not significant (Mann-Whitney test). |