
|
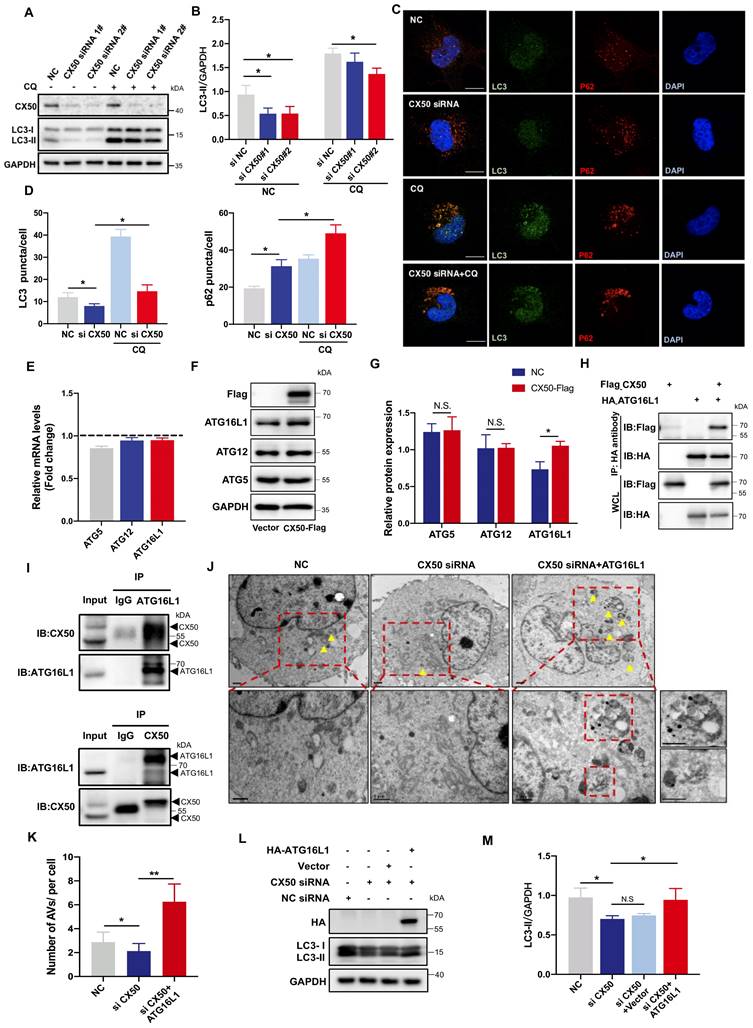
Fig. 1 ATG16L1 is crucial for lens autophagy induced by CX50. (A) Western blot analysis of LC3-I/II and CX50 in NC or CX50-knockdown HLE cells treated with or without 30 µM CQ for 6 h. (B) Quantification of LC3 levels, n = 3. Mann-Whitney test. (C) Representative images of LC3 and p62 puncta in NC and CX50-knockdown HLE cells treated with or without CQ (n = 3, > 30 cells per experiment), scale bar: 10 µm. (D) Quantification of LC3 and p62 puncta per cell, n = 3, > 30 cells per experiment (Mann-Whitney test). (E-G) mRNA(E) and protein levels (F and G) of ATG5, ATG12, and ATG16L1 in CX50 over-expressing HLE cells. (H) Immunoblot of Co-IP from Flag-CX50 with HA-ATG16L1 in HEK293T cells. WCL: whole cell lysis. (I) IP analysis of the interaction between CX50 and ATG16L1 in HLE cells. (J) Electron micrographs of HLE cells and (K) quantification of the AVs per cell. Yellow arrows indicate autophagic vacuoles (AVs). ≥ 8 cells per experiment (Student's t-test analysis), scale bar: 1 µm. (L) Western blot analysis of LC3-II and HA in NC or CX50-knockdown HLE cells transfected with vector or ATG16L1. (M) Quantification analysis of LC3 levels, n = 3. Mean ± SD, *p < 0.05, **p < 0.01. N.S. not significant (Mann-Whitney test).