
- Title
-
FBLN2 is associated with Goldenhar syndrome and is essential for cranial neural crest cell development
- Authors
- Niu, X., Zhang, F., Gu, W., Zhang, B., Chen, X.
- Source
- Full text @ Ann N Y Acad Sci
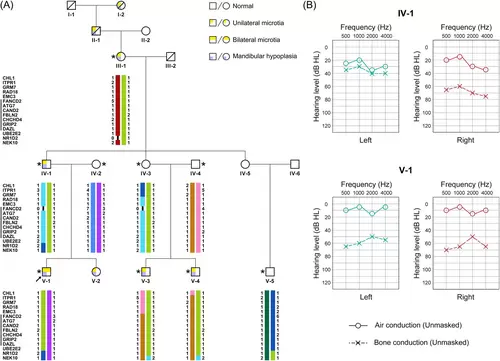
Clinical presentation of the Goldenhar syndrome pedigree. (A) Diagram of the five-generation pedigree and linkage analysis. The most likely haplotypes were calculated via haplotype analysis with collapsed haplotype pattern markers. The significant linkage region between FANCD2 and DAZL on chromosome 3 is shown via the black line. Females are shown with circles and males with squares. Text below the symbols show the ID of each family member. Asterisks show individuals having received whole-exome sequencing. The proband (individual V-1) is marked with a black arrow. (B) Pure-tone audiometry assessment result of family members IV-1 and V-1 |
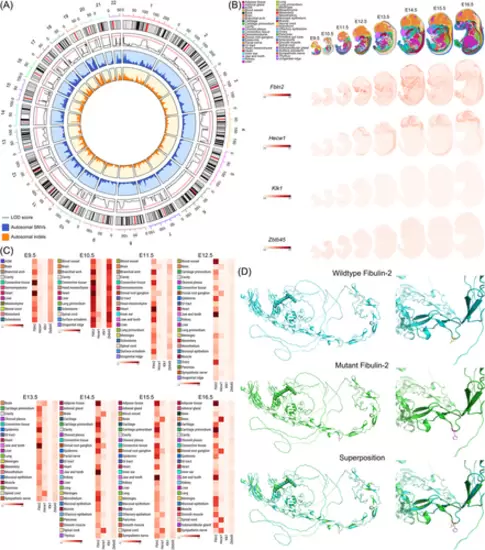
Identification of the FBLN2 mutation. (A) Linkage analysis of autosomal chromosomes of the five-generation pedigree. The tracks from the outside–in illustrate, respectively, (1) the chromosome ideograms; (2) the logarithm of odds (LOD) scores with the significant threshold (LOD = 1.5) marked by the red line and LOD = 0 marked by the gray line; (3) the distribution of autosomal single nucleotide variants (SNVs) in blue; and (4) the distribution of autosomal indels in orange. (B) Spatiotemporal expression of Fbln2, Hecw1, Klk1, and Zbtb45 in mouse embryos. (C) Average expression level of Fbln2, Hecw1, Klk1, and Zbtb45 in each tissue during mouse early development. Genes with higher expression level are shown in darker shades. (D) Tertiary structure prediction of the wild type (blue) and mutant (green) fibulin-2 protein in global and local views. Superposition analysis was also presented to show the changes of the positioning of the side chain. |
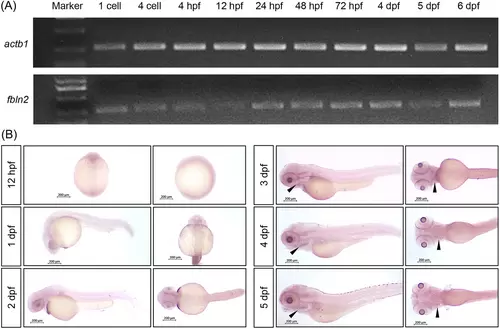
The expression of fbln2 in wild-type zebrafish during early development. (A) Reverse transcription polymerase chain reaction (RT-PCR) demonstrating fbln2 expression in zebrafish embryos (lower panel) with actb1 as the internal control (upper panel). (B) Spatiotemporal expression pattern of fbln2 in zebrafish embryos demonstrated by whole-mount in situ hybridization (WISH) (magnification factor: 4×, bar = 200 μm). Results are shown in lateral and ventral views of embryos at 12 h post fertilization (hpf), 1 day post fertilization (dpf), 2, 3, 4, and 5 dpf. Black arrows indicate specific expression of fbln2 in the mandible at 3 dpf and in the craniofacial cartilage at 4 and 5 dpf. |
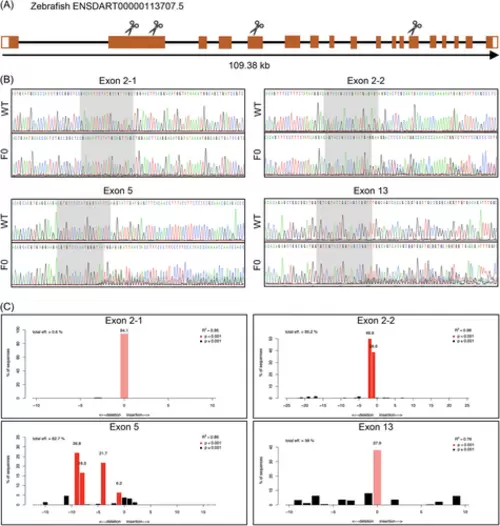
Design and knockout efficacy evaluation of guide RNAs (gRNAs). (A) Structure of zebrafish fbln2 and gRNA target site design. Untranslated regions are marked by white boxes, and coding regions are marked by orange boxes. Scissors represent the target site of the four gRNAs. (B) Verification of induced mutations carried by four gRNA-microinjected embryos (F0) near the target sites by Sanger sequencing. (C) Knockout efficacy calculation of the gRNAs. The R2 and p values were calculated by the software TIDE to assess the goodness of fit and significance of detection. Alleles with p < 0.001 were considered significant and shown in red, among which the unmodified alleles were shown in a lighter shade. Abbreviation: WT, wild type. |

fbln2 knockout in zebrafish induced malformations of craniofacial cartilage. (A) General phenotype changes of F0 mosaic crispants and F2 homozygous mutants (fbln2−/−) compared with the wild type (magnification factor: 3×, n = 30 per group, bar = 200 μm). Both F0 and fbln2−/− showed undeveloped mandible (red arrow heads), pericardial edema (black arrow heads), and delayed or absent swim bladders (blue arrow heads). (B) Alcian blue staining revealed craniofacial cartilage malformation in F0 crispants and F2 fbln2−/− mutants at 4 dpf (magnification factor: 4×, n = 30 per group, bar = 200 μm). Compared with the wild types, F0 and fbln2−/− mutants showed hypoplastic or absent Meckel cartilages, shorter palatoquadrates, widened angle between ceratohyal cartilages, and malformed or absent ceratobranchial cartilages. (C) Wheat germ agglutinin (WGA) staining of 4 dpf embryos revealed disarranged chondrocytes in mandibular cartilages (magnification factor: 20×, n = 30 per group, bar = 50 μm). The chondrocytes were thin and columnar in wild-type embryos, but were smaller and showed reduced aspect ratio in fbln2−/−. Furthermore, the chondrocytes of fbln2−/− were aligned irregularly instead of the stacked-coins arrangement observed in wild-type embryos. Abbreviations: cb, ceratobranchial; ch, ceratohyal; e, ethmoid; hs, hyosymplectic; m, Meckel's cartilage; pq, palatoquadrate; WT, wild type. |
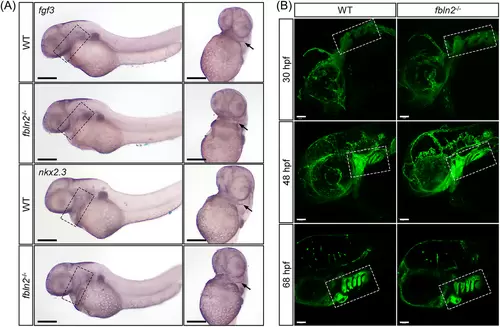
Normal pharyngeal arch structure in fbln2−/− embryos. (A) WISH at 48 hpf showed no significant difference in the expression of pharyngeal pouch marker fgf3 and nkx2.3, and the pharyngeal pouches were normally generated and segmented in fbln2−/− embryos (magnification factor: 4×, n = 30 per group, bar = 200 μm). The pharyngeal pouches are marked by black dashed rectangles in the lateral view (left) and by black arrows in the ventral view (right). (B) The morphology of pharyngeal arches at 30, 48, and 68 hpf were similar between the wild type and fbln2−/− mutants (magnification factor: 20×, n = 30 per group, bar = 50 μm). The pharyngeal arches are marked by white dashed rectangles. Abbreviation: WT, wild type. |

WISH analysis of the effect of fbln2 knockout on cranial neural crest cell (CNCC) development. (A) At 24 h post fertilization (hpf), the expression of the neural crest cell markers crestin (left) and foxd3 (right) is similar in wild type and fbln2−/− embryos (marked by black dashed rectangles, magnification factor: 4×, n = 30 per group, bar = 200 μm). (B) At 48 hpf, the prechondral condensation marker barx1 is expressed similarly (magnification factor: 4×, n = 30 per group, bar = 200 μm) between wild type and fbln2−/− embryos. The pharyngeal arches are shown in black dashed rectangles in the lateral view and black arrows in the ventral view. (C) CNCC chondrogenic differentiation is impaired by fbln2 knockout as demonstrated by the reduced expression of the marker of CNCC differentiation, sox9a, at 72 hpf in fbln2−/− embryos (magnification factor: 4×, n = 30 per group, bar = 200 μm). The mandibular region is marked by black dashed rectangles in the lateral view, and black arrows in the ventral view. (D) At 72 hpf, the expression of the mature chondrocyte marker col2a1a is reduced significantly in the mandible of fbln2−/− embryos (marked by black dashed rectangles, magnification factor: 4×, n = 30 per group, bar = 200 μm). Abbreviation: WT, wild type. |
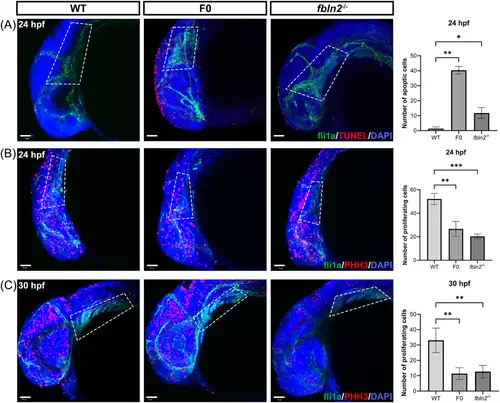
fbln2 knockout causes increased apoptosis and decreased proliferation of CNCCs. (A) Terminal deoxynucleotidyl transferase dUTP nick end labeling (TUNEL) assay of embryos at 24 h post fertilization (hpf) revealed increased apoptotic cells in the dorsal cranial region of F0 and fbln2−/− (magnification factor: 20×, n = 30 per group, bar = 50 μm). The white dashed area highlights the distribution of CNCCs at the pharyngeal arches. Three wild type, three F0, and four fbln2−/− embryos were used for statistics. (B and C) Phosphorylated histone H3 (PHH3) staining revealed decreased proliferation in the craniofacial region and pharyngeal arches of mutant embryos, respectively, at 24 and 30 hpf (magnification factor: 20×, n = 30 per group, bar = 50 μm). The white dashed area highlights the pharyngeal arches. For statistics, six wild type, three F0, and six fbln2−/− embryos at 24 hpf, and three wild type, five F0, and six fbln2−/− embryos at 30 hpf were used. *p < 0.05; ***p < 0.001; ****p < 0.0001. Abbreviation: WT, wild type. |
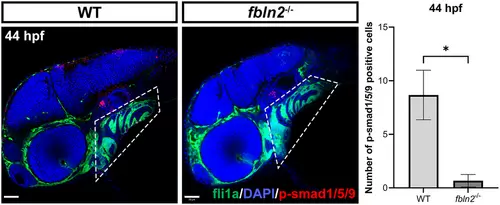
Immunostaining of p-Smad1/5/9 at 44 h post fertilization (hpf) (magnification factor: 20×, n = 30 per group, n = 3 for statistics, bar = 50 μm). p-Smad1/5/9 significantly decreases in the pharyngeal arches of fbln2−/−, indicating reduced activation of the bone morphogenic protein (BMP) signaling pathway signaling. *p < 0.05. Abbreviation: WT, wild type. |