
Fig. 2
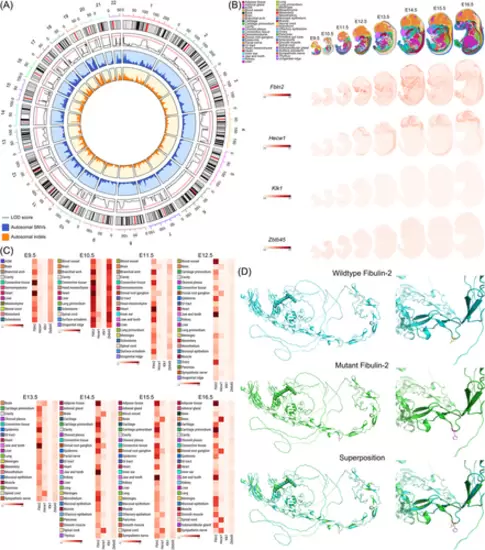
Identification of the FBLN2 mutation. (A) Linkage analysis of autosomal chromosomes of the five-generation pedigree. The tracks from the outside–in illustrate, respectively, (1) the chromosome ideograms; (2) the logarithm of odds (LOD) scores with the significant threshold (LOD = 1.5) marked by the red line and LOD = 0 marked by the gray line; (3) the distribution of autosomal single nucleotide variants (SNVs) in blue; and (4) the distribution of autosomal indels in orange. (B) Spatiotemporal expression of Fbln2, Hecw1, Klk1, and Zbtb45 in mouse embryos. (C) Average expression level of Fbln2, Hecw1, Klk1, and Zbtb45 in each tissue during mouse early development. Genes with higher expression level are shown in darker shades. (D) Tertiary structure prediction of the wild type (blue) and mutant (green) fibulin-2 protein in global and local views. Superposition analysis was also presented to show the changes of the positioning of the side chain. |