|
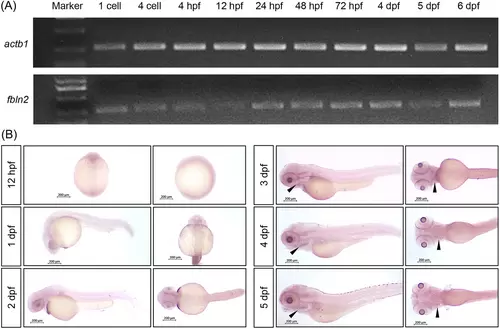
The expression of fbln2 in wild-type zebrafish during early development. (A) Reverse transcription polymerase chain reaction (RT-PCR) demonstrating fbln2 expression in zebrafish embryos (lower panel) with actb1 as the internal control (upper panel). (B) Spatiotemporal expression pattern of fbln2 in zebrafish embryos demonstrated by whole-mount in situ hybridization (WISH) (magnification factor: 4×, bar = 200 μm). Results are shown in lateral and ventral views of embryos at 12 h post fertilization (hpf), 1 day post fertilization (dpf), 2, 3, 4, and 5 dpf. Black arrows indicate specific expression of fbln2 in the mandible at 3 dpf and in the craniofacial cartilage at 4 and 5 dpf.
|