
- Title
-
Lack of nuclear localization of the Creb3l1 transcription factor causes defects in caudal fin bifurcation in zebrafish Danio rerio
- Authors
- VanWinkle, P.E., Wynn, B., Lee, E., Nawara, T.J., Thomas, H., Parant, J.M., Alvarez, C., Serra, R., Sztul, E.
- Source
- Full text @ Cells Tissues Organs
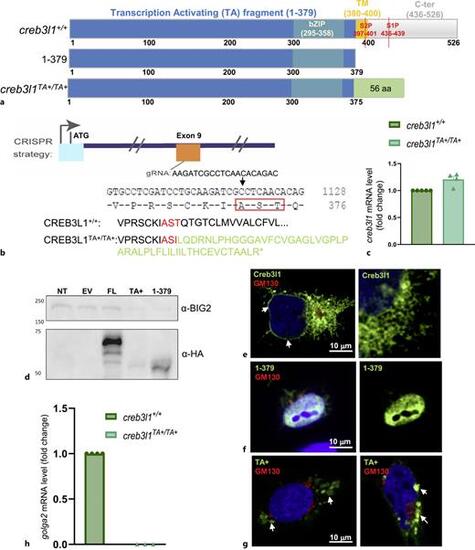
Generating creb3l1 mutant zebrafish. a Schematic representation of constructs expressing full-length zebrafish Creb3l (expressed in creb3l1+/+ fish), a fragment encoding amino acids 1-379 (1-379) that is generated in vivo by S2P cleavage, and the CRISPR/Cas9-generated TA fragment (expressed in creb3l1TA+/TA+ fish). Creb3l1 domains are represented by different colors and the sites cleaved by S1P and S2P are indicated. The 56 random amino acids at the C-terminus of the TA fragment are in green. b Exon 9 of the zebrafish creb3l1 gene was targeted (gRNA sequence is shown) to generate creb3l1TA+/TA+ fish with a +4 bp insertion (5 bp deletion and 9 bp insertion) that causes a frameshift mutation at amino acid 375 (T to I in the AST sequence, boxed in red). The creb3l1TA+/TA+ allele encodes a 375 amino acid fragment of Creb3l1 that contains the TA domain followed by 56 amino acids (in green) not found in Creb3l1. ccreb3l1 mRNA levels were assessed in creb3l1+/+ and creb3l1TA+/TA+ 7 dpf larvae. The creb3l1TA+/TA+ larvae show elevated levels of creb3l1 transcript, but the increase is not statistically significant when the dCq values are compared by an unpaired t-test. n = 4–5. Each data point represents a pool of ∼30 larvae. d HEK cells were mock transfected (lane NT: not transfected), or transfected with empty vector (lane EV), vector encoding wild-type full-length Creb3l1 (lane FL), vector encoding the TA+ fragment (lane TA+), or vector encoding the 1-397 construct (lane 1-379) shown in (a) (each construct tagged with HA at C-terminus). After 24 h, cells were lysed and the lysates analyzed by SDS-PAGE and Western blotting with anti-HA (to detect the construct) and anti-BIG2 (loading control). Bands of the appropriate MW were detected in the relevant lanes, but not in lanes containing untransfected cells or cells transfected with empty vectors, showcasing the specificity of the immunoblot. e–g HeLa cells were transfected with vectors encoding wild-type Creb3l1 (e), the 1-397 construct (f), or the TA+ fragment (g) shown in (a) (each construct tagged with HA at C-terminus), and after 24 h, cells were processed for double immune-fluorescence with anti-HA (to detect the construct) and anti-GM130 (Golgi marker), and stained with DAPI to mark the nuclei. e Wild-type full-length Creb3l1 localizes to ER, as indicated by its presence in ER continuous with the nuclear membrane (left panel, white arrows) and in anastomosing ER tubules in the cell periphery (right panel). N = 60 cells. f The 1-397 fragment is concentrated in the nucleus (left panel; right panel shows only the 1-397 signal), indicating efficient nuclear import. n = 25. g The TA+ fragment is detected in amorphous cytoplasmic foci (left panel, white arrows). In cells expressing higher levels of TA+, the protein is sequestered in cytoplasmic aggregates (right panel, white arrows). N = 60. Scale bars = 10 μm. hgolga2 expression in wild-type creb3l1+/+ and mutant creb3l1T+T/+ regenerates at 5 dpa. An unpaired t-test to compare the dCq values shows a significant decrease in golga2 transcript levels in creb3l1TA+/TA+ fish. p < 0.0001. |
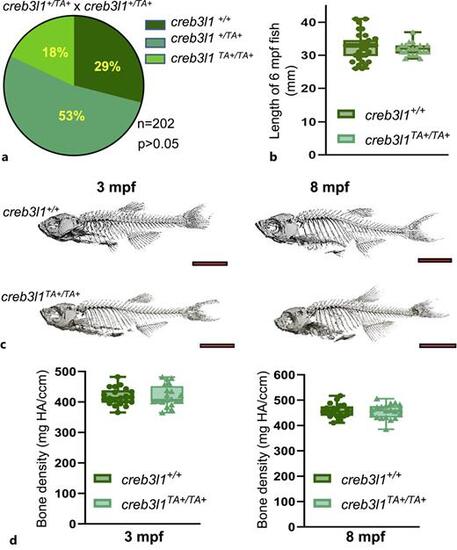
creb3l1TA+/TA+ fish exhibit no significant changes in size, skeletal morphology, or bone density. a Larvae from heterozygous creb3l1TA+/+ incrosses were genotyped at 7 dpf and the recovery ratios are presented. Nearly Mendelian ratios were obtained (χ2 analysis showed no statistical difference between predicted and observed ratios), with a slight decrease in the recovery of creb3l1TA+/TA+ animals. N = 202. b Body length of 6 mpf creb3l1+/+ and creb3l1TA+/TA+ fish was measured. An unpaired t-test with Welch’s correction indicates no significant difference in size. N = 21–34. Each data point represents an individual fish. c Representative μCT scans of creb3l1+/+ and creb3l1TA+/TA+ male fish at 3 and 8 mpf. No obvious defects in skeletal morphology were seen when visualized by 3D projections of the μCT scans. N = 9–11. d Bone density (mgHA/ccm) was measured by μCT scans in creb3l1+/+ and creb3l1TA+/TA+ fish at 3 and 8 mpf. Values for male fish are presented (analogous values were obtained for female fish, data not shown). An unpaired t-test with Welch’s correction shows no significant differences in bone density. N = 9–11. Each data point represents an individual fish. |
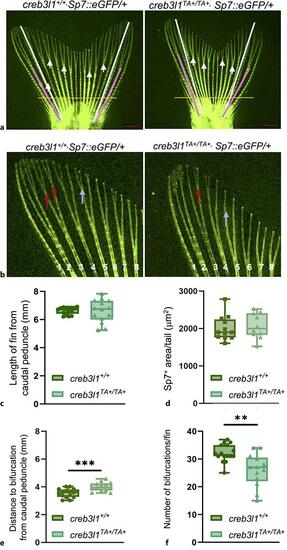
creb3l1TA+/TA+ zebrafish exhibit defects in caudal fin ray bifurcation. a Fins of 6 mpf creb3l1+/+Tg(Sp7:eGFP/+) and creb3l1TA+/TA+Tg(Sp7:eGFP/+) fish were examined by direct fluorescence. The length of fins was measured from the caudal peduncle to the tip of the 3rd ray in both lobes (white lines). Bifurcation depth of the 2nd and 3rd ray was measured from the caudal peduncle to the bifurcation point in both lobes (pink lines) and averaged. Primary bifurcations are marked with white arrows. Orange line demarcates the region used to quantitate Sp7+ area (all area distal to the orange lane). Scale bar = 1 mm. b Higher magnification of representative images of caudal fins from creb3l1+/+Tg(Sp7:eGFP/+) and creb3l1TA+/TA+Tg(Sp7:eGFP/+) fish. Red arrows point to secondary bifurcations of 3rd sister ray, while blue arrows points to a secondary bifurcation of 5th sister ray in wild-type, but not in mutant tail. c The lengths of tails are not significantly different between creb3l1+/+Tg(Sp7:eGFP/+) and creb3l1TA+/TA+Tg(Sp7:eGFP/+ fish when analyzed by an unpaired t-test with Welch’s correction. N = 14–15. Each data point represents an individual fish. d The Sp7+ area/tail is not significantly different between creb3l1+/+Tg(Sp7:eGFP/+) and creb3l1TA+/TA+Tg(Sp7:eGFP/+) fish when assessed by an unpaired t-test. N = 13–23. Each data point represents an individual fish. e The distance from caudal peduncle to the first point of bifurcation is significantly increased in creb3l1TA+/TA+Tg(Sp7:eGFP/+) fins relative to creb3l1+/+Tg(Sp7:eGFP/+) fish when analyzed by an unpaired t-test. ***p ≤ 0.001. N = 13–16. Each data point represents an individual fish. f The total number of bifurcations per fin were assessed and show that creb3l1TA+/TA+Tg(Sp7:eGFP/+) fins have significantly fewer bifurcations/fin relative to creb3l1+/+Tg(Sp7:eGFP/+) fins when assessed by non-parametric Mann-Whitney test. **p ≤ 0.01. N = 13–16. Each data point represents an individual fish. |
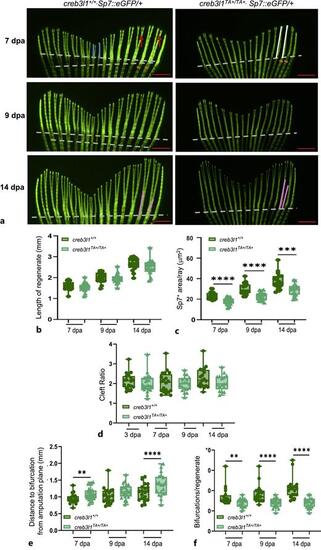
creb3l1TA+/TA+ zebrafish show decreased regenerative capacity of the caudal fin. a Approximately 50% of the caudal fin was amputated from 6 mpf creb3l1+/+Tg(Sp7:eGFP/+) and creb3l1TA+/TA+Tg(Sp7:eGFP/+) fish. At the indicated dpa, tails were imaged by fluorescence. Representative images are shown. Amputation planes are indicated with dashed line in all panels. 7 dpa panels: white lines indicate the length of the 2nd and 3rd ray in the regenerate; red arrows point to secondary bifurcations; sienna lines mark the width of the 2nd and 3rd ray below the amputation plane; and blue lines indicate the rays measured to generate the cleft ratio. 14 dpa panels: pink lines indicate the bifurcation depth of the 2nd and 3rd ray. Scale bars = 1 mm. b Fluorescence images analogous to those in (a) were used to measure the lengths of the 2nd and 3rd ray in both tail lobes at the indicated dpa and averaged. Regenerate lengths are not significantly different between creb3l1+/+Tg(Sp7:eGFP/+) and creb3l1TA+/TA+Tg(Sp7:eGFP/+) fish when analyzed by an unpaired t-test. N = 14–15. Each data point represents an individual fish. c Fluorescence images analogous to those in (a) were used to calculate the area occupied by fluorescent Sp7+ osteoblasts distal to amputation plane, corrected for the average width of all rays in each lobe (Sp7+ area/ray). The creb3l1TA+/TA+Tg(Sp7:eGFP/+) fish show significantly decreased Sp7+ area/ray at all timepoints relative to creb3l1+/+Tg(Sp7:eGFP/+) fish when assessed by an unpaired t-test. ***p ≤ 0.001; ****≤0.0001. N = 13–23. Each data point represents an individual fish. d Fluorescence images analogous to those in (a) were used to measure the lengths of the two fin rays located at the division between the ventral and dorsal lobes (blue lines in [a]) and these values were averaged. The lengths of two longest ventral and dorsal rays (white lines in [a]) in each lobe were measured and averaged. The averaged longest ray length was divided by the average of the cleft ray length to obtain the cleft ratio. Cleft ratios are not significantly different between creb3l1+/+Sp7:eGFP/+ and creb3l1TA+/TA+Sp7:eGFP/+ fish at all assayed dpa when assessed by non-parametric Mann-Whitney test. N = 17–23. Each data point represents an individual fish. e Fluorescence images analogous to those in (a) were used to measure the distance from the amputation plane to first bifurcation in the 2nd and 3rd ray in both lobes and averaged. Significant increase in bifurcation depth is observed in creb3l1TA+/TA+Tg(Sp7:eGFP/+) fish at 7 and 14 dpa when assessed by an unpaired t-test with Welch’s correction. **p ≤ 0.01; ****≤0.0001. N = 18–25. Each data point represents an individual fish. f Fluorescence images analogous to those in (a) were used to count the total number of bifurcations in a regenerate. The creb3l1TA+/TA+Tg(Sp7:eGFP/+) fish have significantly fewer bifurcations/regenerate relative to creb3l1+/+Tg(Sp7:eGFP/+) fish when assessed by non-parametric Mann-Whitney test. **p ≤ 0.01; ****≤0.0001. N = 18–24. Each data point represents an individual fish. |
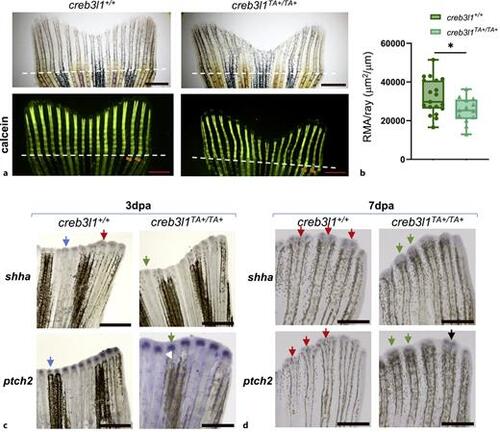
creb3l1TA+/TA+ zebrafish show decreased mineralization and have alterations in expression patterns of Sonic Hedgehog pathway components. a Approximately 50% of the caudal fin was amputated from 6 mpf creb3l1+/+ and creb3l1TA+/TA+ fish. At 9 dpa, the tails were stained with calcein and imaged via brightfield and fluorescence. Representative images are shown. Amputation planes are indicated with dashed lines. Sienna lines in calcein panels mark the width of the 2nd and 3rd rays below the amputation plane. Scale bars = 1 mm. b Fluorescence images analogous to those in (a) were used to measure the fluorescent mineralized area (RMA: total fluorescence distal to amputation plane), which was normalized to the average width of all fin rays below the amputation plane. The creb3l1TA+/TA+ fish exhibit significantly decreased mineralization of the regenerated bone when assessed by an unpaired t-test with Welch’s correction. *p ≤ 0.05. N = 13–19. Each data point represents an individual fish. c, d Approximately 50% of the caudal fin was amputated from 6 mpf creb3l1+/+ and creb3l1TA+/TA+ fish. At 3 dpa (c) and 7 dpa (d), tails were processed for in situ hybridization to detect expression of shha and ptch2 components of the Sonic Hedgehog pathway. Representative images are shown. cshha signal in creb3l1+/+ regenerates is either in a single cap over a regenerating ray (blue arrow) or is already separated into two foci (red arrow). In contrast, in creb3l1TA+/TA+ regenerates, all shha signal is in a single cap over regenerating rays (green arrow). ptch2 signal is in a single cap in both, creb3l1+/+ and creb3l1TA+/TA+ regenerates (blue and green arrow, respectively). d All shha signal in creb3l1+/+ regenerates is separated into two foci (red arrows), but is still within a single cap in creb3l1TA+/TA+ regenerates (green arrows). ptch2 signal in creb3l1+/+ regenerates is separated into two distinct foci (red arrows), but is mostly present in a single diffuse domain in creb3l1TA+/TA+ regenerates (green arrows). Separation of the patch2 signal can be seen in some creb3l1TA+/TA+ regenerates (black arrow). N = 3–7. Scale bars = 1 mm. |