
Fig. 4
- ID
- ZDB-FIG-250501-4
- Publication
- VanWinkle et al., 2024 - Lack of nuclear localization of the Creb3l1 transcription factor causes defects in caudal fin bifurcation in zebrafish Danio rerio
- Other Figures
- All Figure Page
- Back to All Figure Page
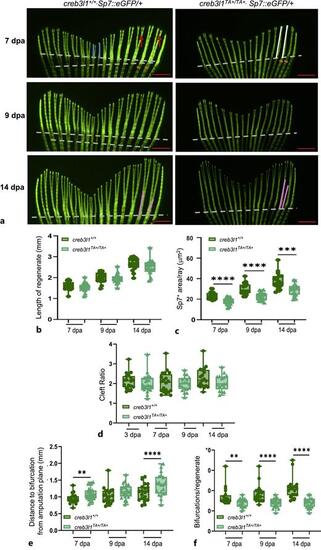
creb3l1TA+/TA+ zebrafish show decreased regenerative capacity of the caudal fin. a Approximately 50% of the caudal fin was amputated from 6 mpf creb3l1+/+Tg(Sp7:eGFP/+) and creb3l1TA+/TA+Tg(Sp7:eGFP/+) fish. At the indicated dpa, tails were imaged by fluorescence. Representative images are shown. Amputation planes are indicated with dashed line in all panels. 7 dpa panels: white lines indicate the length of the 2nd and 3rd ray in the regenerate; red arrows point to secondary bifurcations; sienna lines mark the width of the 2nd and 3rd ray below the amputation plane; and blue lines indicate the rays measured to generate the cleft ratio. 14 dpa panels: pink lines indicate the bifurcation depth of the 2nd and 3rd ray. Scale bars = 1 mm. b Fluorescence images analogous to those in (a) were used to measure the lengths of the 2nd and 3rd ray in both tail lobes at the indicated dpa and averaged. Regenerate lengths are not significantly different between creb3l1+/+Tg(Sp7:eGFP/+) and creb3l1TA+/TA+Tg(Sp7:eGFP/+) fish when analyzed by an unpaired t-test. N = 14–15. Each data point represents an individual fish. c Fluorescence images analogous to those in (a) were used to calculate the area occupied by fluorescent Sp7+ osteoblasts distal to amputation plane, corrected for the average width of all rays in each lobe (Sp7+ area/ray). The creb3l1TA+/TA+Tg(Sp7:eGFP/+) fish show significantly decreased Sp7+ area/ray at all timepoints relative to creb3l1+/+Tg(Sp7:eGFP/+) fish when assessed by an unpaired t-test. ***p ≤ 0.001; ****≤0.0001. N = 13–23. Each data point represents an individual fish. d Fluorescence images analogous to those in (a) were used to measure the lengths of the two fin rays located at the division between the ventral and dorsal lobes (blue lines in [a]) and these values were averaged. The lengths of two longest ventral and dorsal rays (white lines in [a]) in each lobe were measured and averaged. The averaged longest ray length was divided by the average of the cleft ray length to obtain the cleft ratio. Cleft ratios are not significantly different between creb3l1+/+Sp7:eGFP/+ and creb3l1TA+/TA+Sp7:eGFP/+ fish at all assayed dpa when assessed by non-parametric Mann-Whitney test. N = 17–23. Each data point represents an individual fish. e Fluorescence images analogous to those in (a) were used to measure the distance from the amputation plane to first bifurcation in the 2nd and 3rd ray in both lobes and averaged. Significant increase in bifurcation depth is observed in creb3l1TA+/TA+Tg(Sp7:eGFP/+) fish at 7 and 14 dpa when assessed by an unpaired t-test with Welch’s correction. **p ≤ 0.01; ****≤0.0001. N = 18–25. Each data point represents an individual fish. f Fluorescence images analogous to those in (a) were used to count the total number of bifurcations in a regenerate. The creb3l1TA+/TA+Tg(Sp7:eGFP/+) fish have significantly fewer bifurcations/regenerate relative to creb3l1+/+Tg(Sp7:eGFP/+) fish when assessed by non-parametric Mann-Whitney test. **p ≤ 0.01; ****≤0.0001. N = 18–24. Each data point represents an individual fish. |