FIGURE SUMMARY
Title

Inhibition of PIKfyve Leads to Lysosomal Disorders via Dysregulation of mTOR Signaling

Authors
Xia, J., Wang, H., Zhong, Z., Jiang, J.
Source
Full text @ Cells

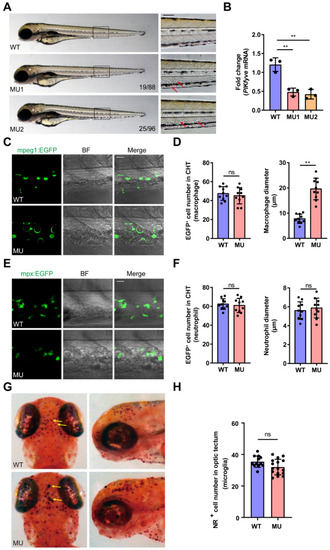
Defects in macrophages in PIKfyve mutant zebrafish embryos. (A) Representative images of WT and MU embryos at 3 dpf. The arrows show the cells with giant vacuole-like structures in the CHT. Cellular death in the mutant brains was evidenced by grey tissue (asterisk). (B) The relative expression levels of PIKfyve in the WT zebrafish and the homozygous mutants (MU1, MU2) were quantified by RT-qPCR. The data were analyzed by 2−∆∆CT method and ꞵ-actin was used as an internal control (** p < 0.01). (CF) PIKfyve mutation was introduced into transgenic zebrfish lines in which macrophages (mpeg1:EGFP) (C,D) or neutrophils (mpx:EGFP) (E,F) were respectively highlighted with EGFP. In the mutant embryos, the macrophages were enlarged with giant vacuoles, while the neutrophils appeared normal. Scale bar, 20 µm. (D) Quantification of macrophage cell number (left panel) and macrophage diameter (right panel) in the CHT (ns, non-significant; ** p < 0.01). (F) Quantification of neutrophil cell number (left panel) and neutrophil diameter (right panel) in the CHT (ns, non-significant). (G,H) NR staining of microglia in WT siblings and PIKfyve mutants at 3 dpf. (G) Dorsal and lateral view of the microglia in the optic tectum of WT and MU larvae at 3 dpf stained with NR. The yellow arrows show the microglia stained with NR. (H) Quantification of NR-positive microglia cell number in the optic tectum of WT and MU larvae at 3 dpf (ns, non-significant).

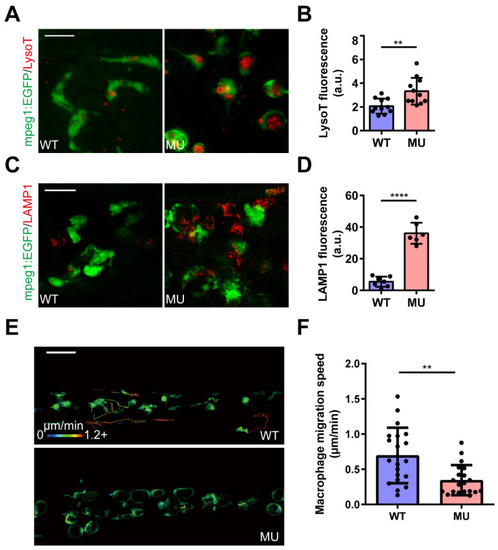
PIKfyve deficiency leads to the accumulation of enlarged LAMP1-positive compartments in macrophages. (AD) The giant vacuoles in mutant macrophages were revealed to be fused lysosomes by staining with LysoTracker (A) or anti-LAMP1 antibody (C). (B) and (D) respectively show the quantification of LysoTracker and LAMP1 fluorescence intensity (** p < 0.01, **** p < 0.0001). Scale bar, 20 µm. (E) Representative confocal images and tracks of macrophage movement in the CHT of WT and MU zebrafish larvae at 3 dpf. Tracks are coded for speed. Scale bar, 50 µm. (F) Quantification of migration speed of macrophages in (E) (** p < 0.01).

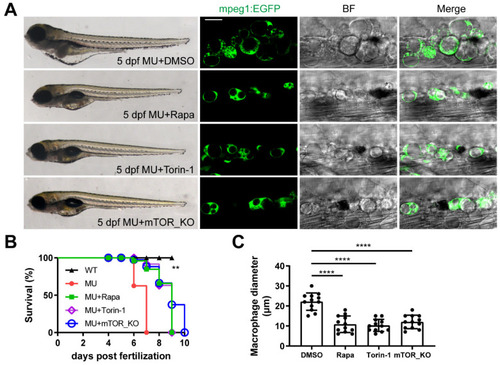
The defects in PIKfyve mutants are dependent on sustained mTOR activation. (A) mTOR inhibitor (Rapa or Torin-1) treatment or effective mTOR knockout (mTOR_KO) attenuates the developmental defects in PIKfyve mutants. Scale bar, 20 µm. (B) Survival curve showing that the lifespan of MU embryos can be extended when mTOR is inhibited by chemical (Rapa, Torin-1) or genetic (mTOR_KO) approaches (N = 3, n = 30 per group). (** p < 0.01, log-rank test). (C) Quantification of diameter of macrophages in MU zebrafish embryos treated as in (A) (**** p < 0.0001, one-way ANOVA).

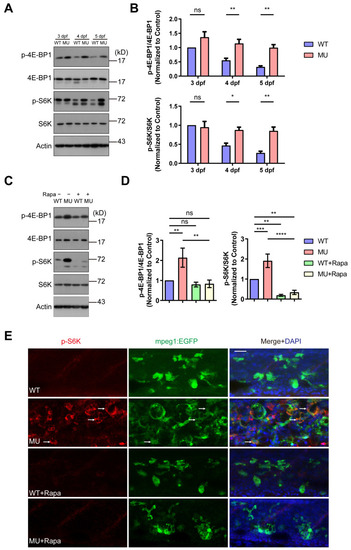
Molecular evidence for the hyperactivation of mTOR signaling in PIKfyve mutant zebrafish. (A) Western blot analysis showing the sustained mTOR activity during early development in PIKfyve mutant zebrafish embryos. (B) Densitometric analysis of phosphorylation status of 4E-BP1 and S6K in (A) (ns, non-significant; * p < 0.05, ** p < 0.01; two-way ANOVA). (C) Western blot analysis of mTOR activity in WT and MU zebrafish embryos at 5 dpf with or without rapamycin treatment. (D) Densitometric analysis of phosphorylation status of 4E-BP1 and S6K in (C) (ns, non-significant; ** p < 0.01, *** p < 0.001, **** p < 0.0001; two-way ANOVA). (E) WT and MU zebrafish embryos with or without rapamycin treatment were fixed at 5 dpf, permeabilized, and immuno-stained with phospho-S6K antibody. Arrows denote the macrophages with intense phospho-S6K staining. Scale bar, 20 µm.

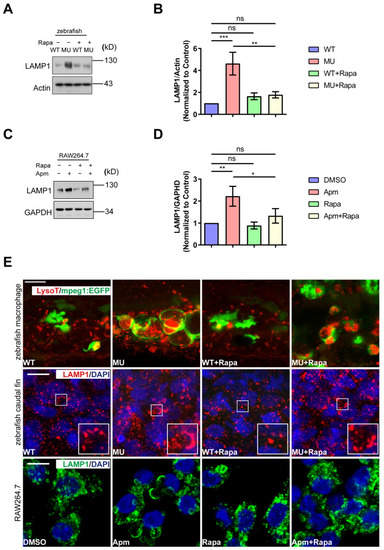
Rapamycin treatment ameliorates the lysosomal defects induced by PIKfyve deficiency in vivo and in vitro. (AD) Western blot analysis showing the rapamycin treatment restored the elevated LAMP1 level induced by PIKfyve deficiency in zebrafish (A,B) and RAW264.7 cells (C,D). (B) and (D) are densitometric analysis of phosphorylation status of 4E-BP1 and S6K in (A) and (C), respectively (ns, non-significant; * p < 0.05, ** p < 0.01, *** p < 0.001; one-way ANOVA). (E) Lysotracker and LAMP1 staining in zebrafish and RAW264.7 cells. The Lysotracker/LAMP1-positive vacuoles were significantly enlarged in PIKfyve mutant cells and in Apm-treated cells, which were ameliorated by rapamycin treatment.

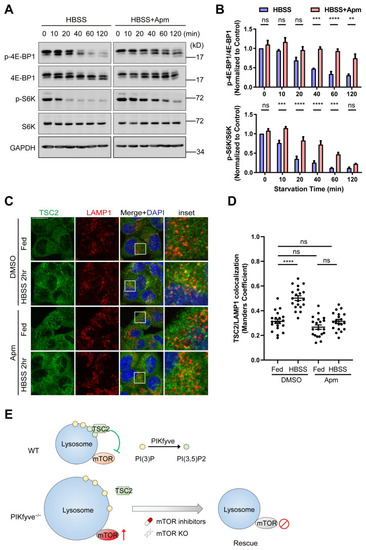
PIKfyve is required for starvation-induced mTOR shutdown. (A) HeLa cells were pretreated with DMSO vehicle control or 200 nM Apm for 3 h, followed by starvation in HBSS in the absence or in the presence of 200 nM Apm (HBSS + Apm) for the indicated time. Lysates were probed with the indicated antibodies. (B) Densitometric analysis of phosphorylation status of 4E-BP1 and S6K in (A). Data are represented as mean ± SD of 3 independent experiments (ns, non-significant; ** p < 0.01, *** p < 0.001, **** p < 0.0001; two-way ANOVA). (C) HeLa cells were treated as in (A), fixed at the selected time point 0 (Fed) and 120 min (HBSS 2 h). Cells were stained with the indicated antibodies and visualized by confocal microscopy. Scale bar, 20 µm. (D) Quantification of TSC2/LAMP1 colocalization from (C) (**** p < 0.0001, one-way ANOVA). (E) A working model for PIKfyve-dependent regulation of mTOR activity. The red arrow pointing upward indicates hyperactivation of mTOR activity. The prohibition sign indicates mTOR inhibition.

Acknowledgments
This image is the copyrighted work of the attributed author or publisher, and ZFIN has permission only to display this image to its users. Additional permissions should be obtained from the applicable author or publisher of the image. Full text @ Cells