FIGURE SUMMARY
Title

Zebrafish Avatar-test forecasts clinical response to chemotherapy in patients with colorectal cancer

Authors
Costa, B., Estrada, M.F., Gomes, A., Fernandez, L.M., Azevedo, J.M., Póvoa, V., Fontes, M., Alves, A., Galzerano, A., Castillo-Martin, M., Herrando, I., Brandão, S., Carneiro, C., Nunes, V., Carvalho, C., Parvaiz, A., Marreiros, A., Fior, R.
Source
Full text @ Nat. Commun.

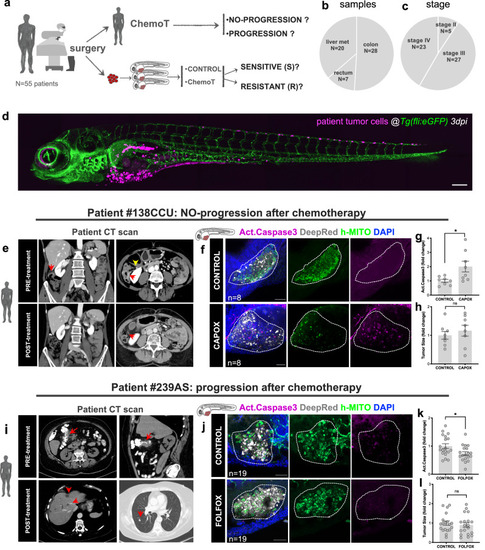
Clinical study design, patient cohort and examples of zAvatars analysis.

a Design of the study: zAvatars of 55 CRC patients were generated and treated in vivo with the same therapy of the corresponding patient. Response to treatment was compared between patients and their matching zAvatar. b Type and (c) stage of CRC samples included in the study. d Representative image of a zAvatar at 3dpi. Scale bar represents 200 µm. e Axial (left image) and coronal (right image) computed tomography (CT) images from patient#138CCU showing the primary tumor (red arrows) in the hepatic flexure of the colon (yellow arrow). Post-operative follow-up imaging revealed no signs of disease recurrence, representing an example of a patient with no-progression. The red arrow indicates right hemicolectomy. f zAvatars#138CCU were generated by injecting colon cancer cells from patient #138CCU into the PVS of 2dpf zebrafish embryos. At 1dpi zAvatars underwent the same therapy as the patient (CAPOX) for 2 consecutive days and then compared to untreated controls. Quantification of apoptosis (activated caspase3) in control and treated zAvatars (g, p = 0.0281). i CT scan from patient#239AS displays irregular wall thickening of the hepatic flexure (red arrows) suggestive of colon cancer. Post-operative follow-up imaging reveals multiple hypodense lesions on liver parenchyma (left image) and a lung lesion (right image) (red arrows), thus representing an example of a patient who progressed. j zAvatar#239AS were generated by injecting colon cancer cells from patient #239AS into the PVS of 2dpf zebrafish embryos. At 1dpi zAvatars underwent the same adjuvant chemotherapy as the patient (FOLFOX) for 2 consecutive days and then compared to untreated controls. zAvatars did not show activation of apoptosis after treatment (k, p = 0.0313). In both examples, tumor cells are labeled in white (cell tracker DeepRed) and DAPI in blue. Maximum Z projections of human-mitochondria marker are shown in green and activated Caspase3 in magenta. Apoptosis (activated Caspase3) (g, k) and tumor size (h, l) were quantified at 3dpi. Results are expressed as AVG ± SEM. Each dot represents one zAvatar and the total number (n) of zAvatars analyzed is indicated in the images. A dashed white line delineates the tumor. Scale bars=50μm. Data were analyzed using unpaired two-sided Mann–Whitney test: (ns) > 0.05, *p ≦ 0.05. Source data are provided as a Source Data file.

Apoptosis in CRC zAvatars predicts patient clinical response to treatment.

a Apoptosis fold change in zAvatars derived from patients with no-progression (N = 33 patients, a total of 667 zAvatars analyzed) is significantly higher than zAvatars derived from patients with progression (N = 22 patients, a total of 518 zAvatars analyzed); total N = 55 patients, p < 0.0001. b The same trend was observed in stage II/III patients: N = 26 patients with no-progression (530 zAvatars analyzed) vsN = 6 patients with progression (137 zAvatars analyzed); total N = 32 patients, p = 0.0363; and (c) in stage IV patients: N = 7 patients with no-progression (137 zAvatars analyzed) vs N = 16 patients with progression (381 zAvatars analyzed); total N = 23 patients, p = 0.0099. Results are expressed as AVG ± SEM. N = number of patients. Data were analyzed using unpaired two-sided Mann–Whitney test: (ns) > 0.05, *p ≦ 0.05, **p ≦ 0.01, ****p ≦ 0.0001. d ROC analysis of the average fold change of apoptosis for both no-progression (N = 33 patients) and progression patients (N = 22 patients) of all 55 patients. The area under the curve was 0.839, supporting the ability of the zAvatar-test to discriminate no-progression from progression patients. e A cut-off value of 1.34 was identified as the optimal threshold, with 91% specificity and 76% sensitivity (N = 55 patients). f Confusion matrix displays the number of patients with actual and predicted responses in zAvatars, i.e., sensitive (S) are zAvatars whose fold induction of apoptosis was >1.34, while zAvatars with fold induction of apoptosis ≤1.34 are classified as resistant (R). g Values for sensitivity, specificity, positive predictive value (PPV) and negative predictive value (NPV). Source data are provided as a Source Data file.

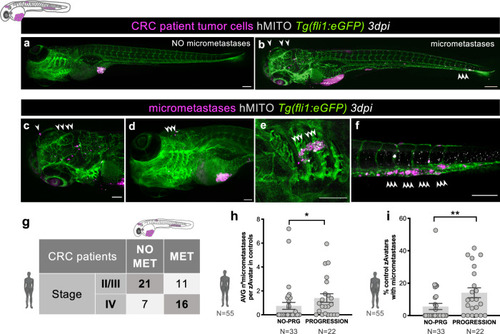
Metastatic potential in zAvatars correlates with tumor staging and patient clinical progression.

a Example of a zAvatar without micrometastases and (b) example of a zAvatar with micrometastases, indicated by the white arrows. Scale bars represent 200 µm. Magnification of several examples of micrometastases in the brain (c, d), gills (e) and caudal hematopoietic tissue (CHT) (f) at 3dpi. Scale bars represent 100 µm. g Confusion matrix displays the number of patients with actual and predicted metastases formation in zAvatars, i.e., 16 patients from stage IV presented also micrometastases in the correspondent zAvatar, while 21 patients from stages II and III did not. h The number of micrometastases in each zAvatar (untreated controls) was quantified and then the average per zAvatar for each patient was calculated. zAvatars from patients with disease progression (N = 22 patients, a total of 763 zAvatars analyzed) exhibited a higher incidence of micrometastases in comparison with zAvatars from patients with no-progression (N = 33 patients, a total of 599 zAvatars analyzed); total N = 55 patients, p = 0.016. i The percentage of zAvatars in control showing micrometastases at 3dpi was quantified and zAvatars from patients with disease progression (N = 22 patients, a total of 763 zAvatars analyzed) exhibited a higher incidence of micrometastases in comparison with zAvatars from patients with no-progression (N = 33 patients, a total of 599 zAvatars analyzed); total N = 55 patients, p = 0.0055. Results are expressed as AVG ± SEM. N = number of patients. Data were analyzed using unpaired two-sided Mann–Whitney test: *p ≦ 0.05, **p ≦ 0.01. Source data are provided as a Source Data file.

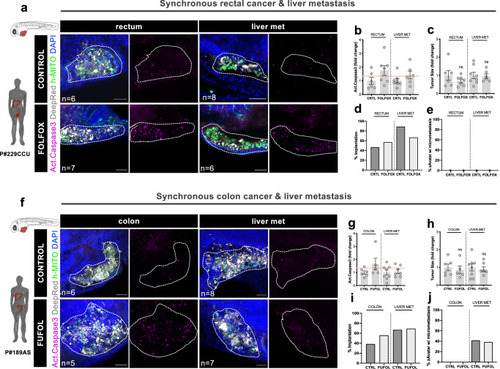
zAvatars can reveal patient intra-tumoral heterogeneity.

a zAvatars were generated from a synchronous surgery of rectal cancer & liver metastasis (patient#229CCU), treated with FOLFOX and compared to untreated controls. f zAvatars were generated from a synchronous surgery of colon cancer & liver metastasis (patient#189AS), treated with FUFOL and compared to untreated controls. At 3dpi, apoptosis (b, g), tumor size (c, h), implantation rates (d, i) and metastatic potential (e, j) were analyzed. Tumor cells are labeled in white (Deep Red), Activated Caspase 3 in magenta, DAPI in blue and human-mitochondria marker in green. Data is expressed as AVG ± SEM. Each dot represents one zAvatar and the total number (n) of zAvatars analyzed is indicated in the images. Dashed white line in the images is delimitating the tumor of each zAvatar. Scale bars represent 50 µm. Dashed line in the graphs is marking the 1.34 threshold defined by the ROC curve (b, g). Data were analyzed using unpaired two-sided Mann–Whitney test: (ns) > 0.05. Source data are provided as a Source Data file.

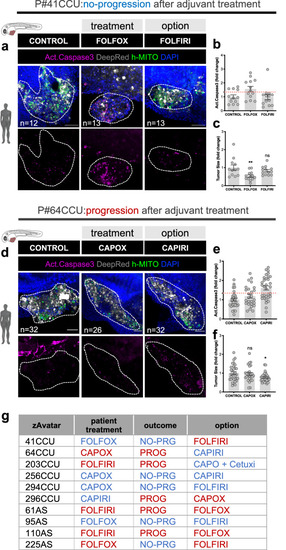
The zAvatar-test can be used to test alternative therapy options.

ac zAvatar#41CCU was treated in vivo with FOLFOX (chemotherapy regimen) and FOLFIRI (alternative regimen) and compared with untreated controls. df zAvatar#64CCU was treated in vivo with CAPOX (chemotherapy regimen) and CAPIRI (alternative regimen) and compared with untreated controls. For all examples, apoptosis (b, e) and tumor size (c, f) were analyzed at 3dpi. Tumor cells are labeled in white (Deep Red), activated Caspase 3 in magenta, DAPI in blue and human-mitochondria marker in green. Data is expressed as AVG ± SEM. Each dot represents one zAvatar and the total number (n) of zAvatars analyzed is indicated in the images. Dashed white line is delimitating the tumor of each zAvatar. Scale bars represent 50 µm. Dashed line in the graphs is marking the 1.34 threshold defined by the ROC curve (b, e). Data were analyzed using unpaired two-sided Mann–Whitney test: (ns) > 0.05, *p = 0.0403, **p = 0.0082. g Examples of zAvatars tested with the chemotherapy taken by the patient, their clinical outcome and the alternative option. Blue depicts sensitivity and red resistance to treatment. Source data are provided as a Source Data file.

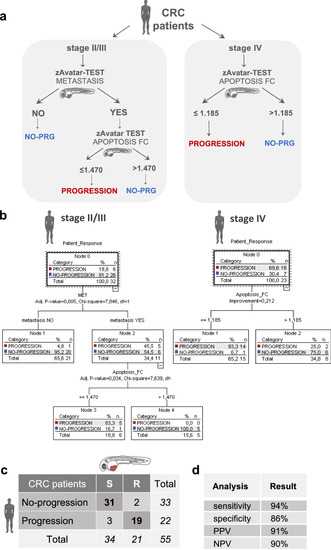
Decision tree model improves accuracy of the zAvatar-test.

a Decision tree model takes into account tumor stage, zAvatar-metastatic potential and zAvatar-apoptosis fold change (“Apoptosis_FC”). b The “Patient Response” (Progression/No-Progression) was the dependent variable, while the “Stage Tumor”, “Apoptosis_FC” and presence of “Metastasis” were the independent variables. Parent node = 5 cases; child node = 5 cases; overall percentage of correlation = 91%. c New confusion matrix according to the decision tree displays the number of patients with actual and predicted responses in zAvatars. Stage II/III sensitive (S) patients refers to patients’ whose zAvatars have no metastasis or patients’ whose zAvatars present metastasis but the induction of apoptosis is >1.47. Stage IV sensitive (S) patients refers to patients’ whose zAvatars fold induction of apoptosis is >1.185. Conversely, stage II/III zAvatars with presence of metastasis and fold induction of apoptosis ≤1.47, along stage IV zAvatars whose fold induction of apoptosis ≤1.185 are classified as resistant (R). d New values for sensitivity, specificity, PPV and NPV for the zAvatar-test taking into account the tree decision model. Source data are provided as a Source Data file.

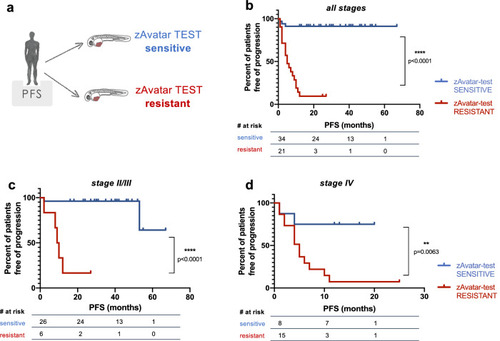
Patients with a sensitive zAvatar-test have longer Progression-Free Survival.

a Kaplan–Meier survival curves were performed comparing the PFS of patients based on sensitivity or resistance of their zAvatar-test (taking into account the tree decision model). The PFS was calculated from the initiation of chemotherapy until either last observation or date of progression. b When analyzing patients from all stages, the zAvatar sensitive group had a longer mean PFS of 30.9 months compared to 7.5 months for the resistant group (N = 55 patients; p < 0.0001). c, d Similarly, in stage II/III patients the mean PFS was 37.0 months versus 11.3 months (N = 32 patients; p < 0.0001), and in stage IV patients the mean PFS was 11.4 months versus 5.9 months (N = 23 patients; p = 0.0063). Source data are provided as a Source Data file.

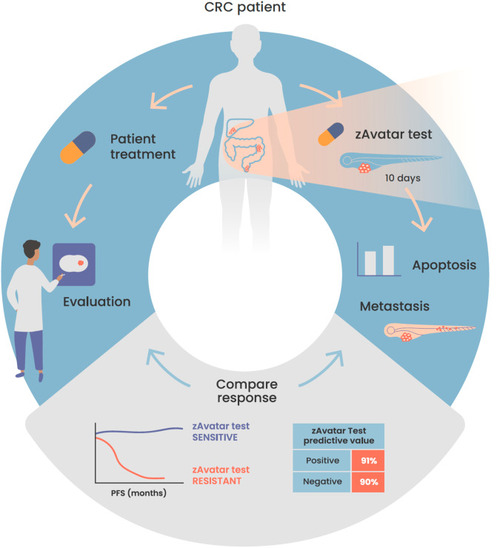
Schematic illustration of the workflow of the zAvatar-test and obtained results.

Our findings demonstrate that the zAvatar-test is an accurate screening-platform for predicting colorectal cancer treatment outcomes. Illustration by Marta Correia.

Acknowledgments
This image is the copyrighted work of the attributed author or publisher, and ZFIN has permission only to display this image to its users. Additional permissions should be obtained from the applicable author or publisher of the image. Full text @ Nat. Commun.