FIGURE

Fig. 4

ID
ZDB-FIG-240607-102
Publication
Costa et al., 2024 - Zebrafish Avatar-test forecasts clinical response to chemotherapy in patients with colorectal cancer
Other Figures
All Figure Page
Back to All Figure Page
Fig. 4

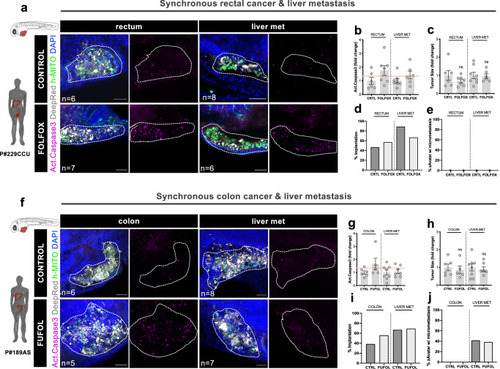
zAvatars can reveal patient intra-tumoral heterogeneity.

a zAvatars were generated from a synchronous surgery of rectal cancer & liver metastasis (patient#229CCU), treated with FOLFOX and compared to untreated controls. f zAvatars were generated from a synchronous surgery of colon cancer & liver metastasis (patient#189AS), treated with FUFOL and compared to untreated controls. At 3dpi, apoptosis (b, g), tumor size (c, h), implantation rates (d, i) and metastatic potential (e, j) were analyzed. Tumor cells are labeled in white (Deep Red), Activated Caspase 3 in magenta, DAPI in blue and human-mitochondria marker in green. Data is expressed as AVG ± SEM. Each dot represents one zAvatar and the total number (n) of zAvatars analyzed is indicated in the images. Dashed white line in the images is delimitating the tumor of each zAvatar. Scale bars represent 50 µm. Dashed line in the graphs is marking the 1.34 threshold defined by the ROC curve (b, g). Data were analyzed using unpaired two-sided Mann–Whitney test: (ns) > 0.05. Source data are provided as a Source Data file.

Expression Data

Expression Detail
Antibody Labeling
Phenotype Data

Phenotype Detail
Acknowledgments
This image is the copyrighted work of the attributed author or publisher, and ZFIN has permission only to display this image to its users. Additional permissions should be obtained from the applicable author or publisher of the image. Full text @ Nat. Commun.