|
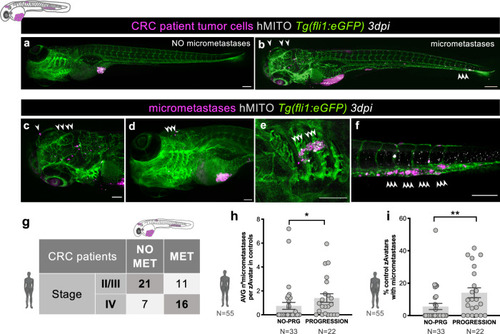
Metastatic potential in zAvatars correlates with tumor staging and patient clinical progression. a Example of a zAvatar without micrometastases and (b) example of a zAvatar with micrometastases, indicated by the white arrows. Scale bars represent 200 µm. Magnification of several examples of micrometastases in the brain (c, d), gills (e) and caudal hematopoietic tissue (CHT) (f) at 3dpi. Scale bars represent 100 µm. g Confusion matrix displays the number of patients with actual and predicted metastases formation in zAvatars, i.e., 16 patients from stage IV presented also micrometastases in the correspondent zAvatar, while 21 patients from stages II and III did not. h The number of micrometastases in each zAvatar (untreated controls) was quantified and then the average per zAvatar for each patient was calculated. zAvatars from patients with disease progression (N = 22 patients, a total of 763 zAvatars analyzed) exhibited a higher incidence of micrometastases in comparison with zAvatars from patients with no-progression (N = 33 patients, a total of 599 zAvatars analyzed); total N = 55 patients, p = 0.016. i The percentage of zAvatars in control showing micrometastases at 3dpi was quantified and zAvatars from patients with disease progression (N = 22 patients, a total of 763 zAvatars analyzed) exhibited a higher incidence of micrometastases in comparison with zAvatars from patients with no-progression (N = 33 patients, a total of 599 zAvatars analyzed); total N = 55 patients, p = 0.0055. Results are expressed as AVG ± SEM. N = number of patients. Data were analyzed using unpaired two-sided Mann–Whitney test: *p ≦ 0.05, **p ≦ 0.01. Source data are provided as a Source Data file.
|