IMAGE

Fig. 1

ID
ZDB-IMAGE-240607-96
Source
Figures for Costa et al., 2024
Image
Figure Caption

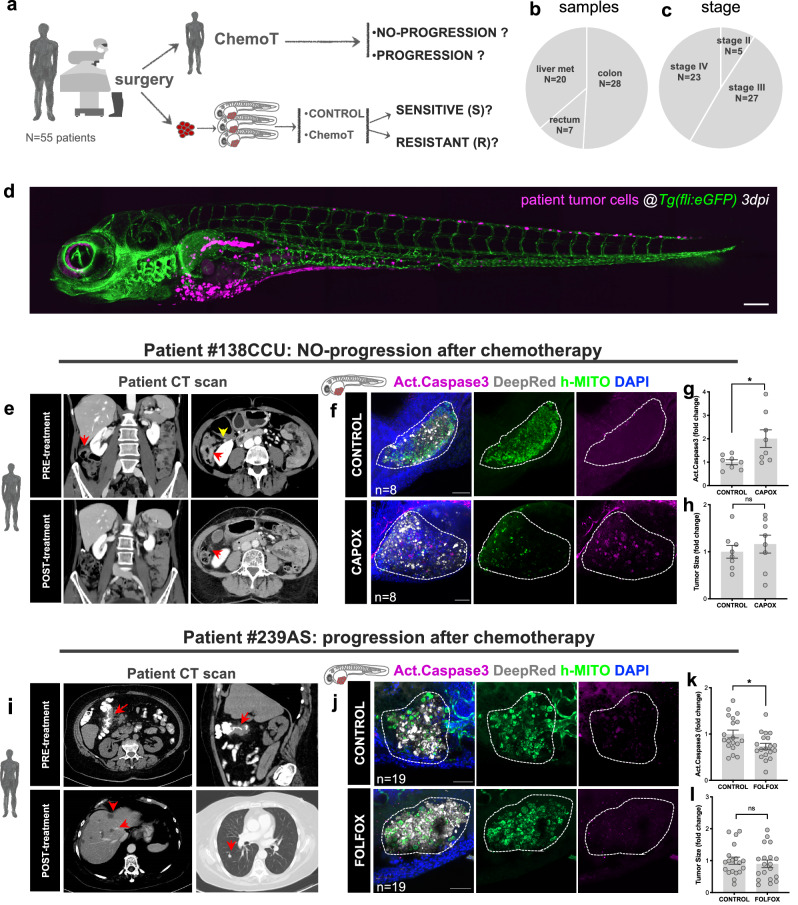
Fig. 1 Clinical study design, patient cohort and examples of zAvatars analysis.

a Design of the study: zAvatars of 55 CRC patients were generated and treated in vivo with the same therapy of the corresponding patient. Response to treatment was compared between patients and their matching zAvatar. b Type and (c) stage of CRC samples included in the study. d Representative image of a zAvatar at 3dpi. Scale bar represents 200 µm. e Axial (left image) and coronal (right image) computed tomography (CT) images from patient#138CCU showing the primary tumor (red arrows) in the hepatic flexure of the colon (yellow arrow). Post-operative follow-up imaging revealed no signs of disease recurrence, representing an example of a patient with no-progression. The red arrow indicates right hemicolectomy. f zAvatars#138CCU were generated by injecting colon cancer cells from patient #138CCU into the PVS of 2dpf zebrafish embryos. At 1dpi zAvatars underwent the same therapy as the patient (CAPOX) for 2 consecutive days and then compared to untreated controls. Quantification of apoptosis (activated caspase3) in control and treated zAvatars (g, p = 0.0281). i CT scan from patient#239AS displays irregular wall thickening of the hepatic flexure (red arrows) suggestive of colon cancer. Post-operative follow-up imaging reveals multiple hypodense lesions on liver parenchyma (left image) and a lung lesion (right image) (red arrows), thus representing an example of a patient who progressed. j zAvatar#239AS were generated by injecting colon cancer cells from patient #239AS into the PVS of 2dpf zebrafish embryos. At 1dpi zAvatars underwent the same adjuvant chemotherapy as the patient (FOLFOX) for 2 consecutive days and then compared to untreated controls. zAvatars did not show activation of apoptosis after treatment (k, p = 0.0313). In both examples, tumor cells are labeled in white (cell tracker DeepRed) and DAPI in blue. Maximum Z projections of human-mitochondria marker are shown in green and activated Caspase3 in magenta. Apoptosis (activated Caspase3) (g, k) and tumor size (h, l) were quantified at 3dpi. Results are expressed as AVG ± SEM. Each dot represents one zAvatar and the total number (n) of zAvatars analyzed is indicated in the images. A dashed white line delineates the tumor. Scale bars=50μm. Data were analyzed using unpaired two-sided Mann–Whitney test: (ns) > 0.05, *p ≦ 0.05. Source data are provided as a Source Data file.

Acknowledgments
This image is the copyrighted work of the attributed author or publisher, and ZFIN has permission only to display this image to its users. Additional permissions should be obtained from the applicable author or publisher of the image. Full text @ Nat. Commun.