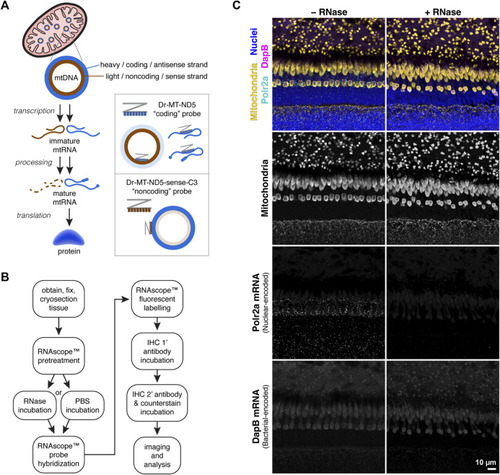
(A) Simplified schematic of protein synthesis from mtDNA. mtRNA transcripts from the mtDNA coding strand are processed and translated into protein; transcripts from the noncoding strand are typically degraded. Accordingly, the RNAscope™ Dr-MT-ND5 “coding” probe reports both mtRNA and mtDNA, while the “noncoding” probe reports primarily mtDNA. (B) Workflow for mtDNA and mtRNA detection using RNAscope™ and IHC. RNAscope™ steps were carried out using the manufacturer’s protocol for the Fluorescent Multiplex v2 kit, with modifications listed in the methods section. (C) Images of zebrafish outer retina stained with a control probe against Polr2a nuclear-encoded mRNA, and a control probe against bacterial-encoded DapB mRNA. RNase treatment eliminates Polr2a mRNA signal.
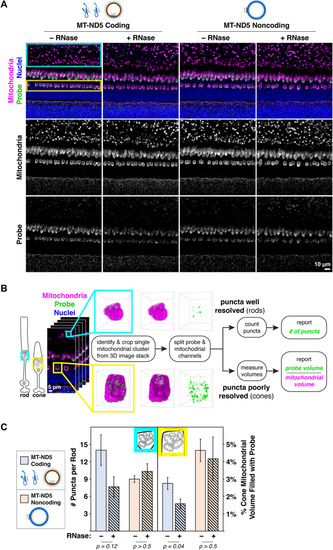
(A) Images of zebrafish outer retina showing signals from RNAscope™ MT-ND5 coding and noncoding probes. Cyan and yellow boxes indicate respective locations of rod and cone mitochondrial clusters used for quantification. RNase was used to determine signal contributions of RNA for each probe. All sections were counterstained for nuclei and mitochondria via IHC. Green–probe (ISH), magenta–mitochondria (IHC), blue–nuclei. (B) Workflow for quantification of MT-ND5 probe signals as either puncta counts or percent of mitochondrial volume. (C) Quantification of signals from coding and noncoding probes, including RNase conditions. Error bars represent standard error of the mean; p values determined using a Mann-Whitney test.
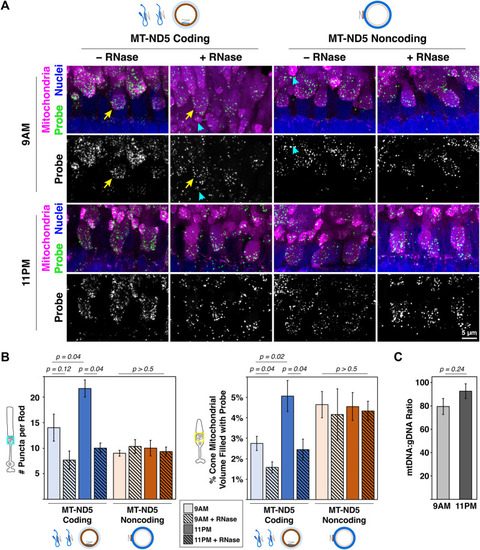
(A) Sample images of zebrafish photoreceptor mitochondrial clusters from 9 a.m. to 11 p.m. labeled with RNAscope™ MT-ND5 coding or noncoding probes. RNase was used to determine signal contributions of RNA for each probe. All sections were counterstained for nuclei and mitochondria via IHC. Cyan arrowheads and yellow arrows indicate examples of single rod and cone mitochondrial clusters used for quantification, respectively. Green–probe (ISH), magenta–mitochondria (IHC), blue–nuclei. (B) Quantification of signals from coding and noncoding probes at 9 a.m. and 11 p.m., including RNase conditions. (C) Ratios of mtDNA to gDNA measured using RT-qPCR from whole zebrafish retinas at 9 a.m. and 11 p.m.. For all graphs, error bars represent standard error of the mean; p values determined using a Mann-Whitney test.
Acknowledgments
This image is the copyrighted work of the attributed author or publisher, and
ZFIN has permission only to display this image to its users.
Additional permissions should be obtained from the applicable author or publisher of the image.
Full text @ Front Cell Dev Biol
Your Input Welcome
Thank you for submitting comments. Your input has been emailed to ZFIN curators who may contact you if
additional information is required.
Oops. Something went wrong. Please try again later.