|
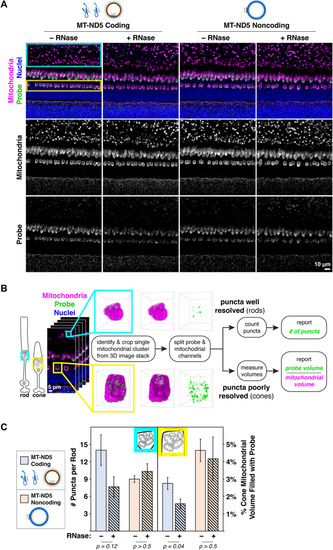
(A) Images of zebrafish outer retina showing signals from RNAscope™ MT-ND5 coding and noncoding probes. Cyan and yellow boxes indicate respective locations of rod and cone mitochondrial clusters used for quantification. RNase was used to determine signal contributions of RNA for each probe. All sections were counterstained for nuclei and mitochondria via IHC. Green–probe (ISH), magenta–mitochondria (IHC), blue–nuclei. (B) Workflow for quantification of MT-ND5 probe signals as either puncta counts or percent of mitochondrial volume. (C) Quantification of signals from coding and noncoding probes, including RNase conditions. Error bars represent standard error of the mean; p values determined using a Mann-Whitney test.
|