|
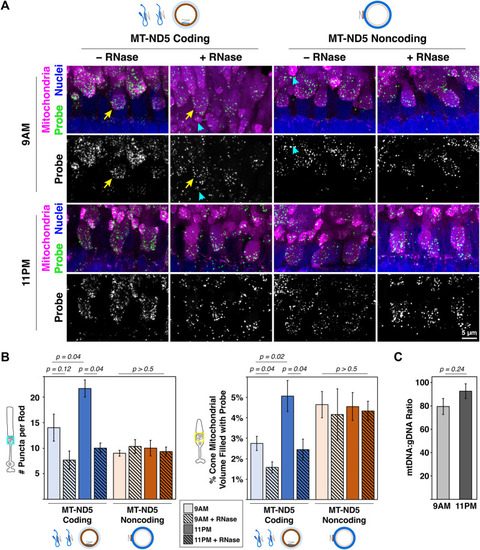
(A) Sample images of zebrafish photoreceptor mitochondrial clusters from 9 a.m. to 11 p.m. labeled with RNAscope™ MT-ND5 coding or noncoding probes. RNase was used to determine signal contributions of RNA for each probe. All sections were counterstained for nuclei and mitochondria via IHC. Cyan arrowheads and yellow arrows indicate examples of single rod and cone mitochondrial clusters used for quantification, respectively. Green–probe (ISH), magenta–mitochondria (IHC), blue–nuclei. (B) Quantification of signals from coding and noncoding probes at 9 a.m. and 11 p.m., including RNase conditions. (C) Ratios of mtDNA to gDNA measured using RT-qPCR from whole zebrafish retinas at 9 a.m. and 11 p.m.. For all graphs, error bars represent standard error of the mean; p values determined using a Mann-Whitney test.
|