
- Title
-
A JAGN1-associated severe congenital neutropenia zebrafish model revealed an altered G-CSFR signaling and UPR activation
- Authors
- Doll, L., Welte, K., Skokowa, J., Bajoghli, B.
- Source
- Full text @ Blood Adv
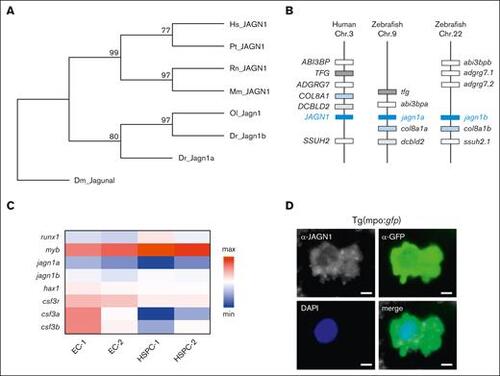
The evolution of JAGN1 gene and the expression patterns of its homologs in zebrafish. (A) A neighbor-joining phylogenetic tree of JAGN1 proteins performed with 1000 bootstrap replications. Branch labels represent consensus support in percentage. (B) Schematic comparison of genomic synteny between human JAGN1 and zebrafish jagn1a and jagn1b loci. (C) Heat map representing gene expression levels in sorted endothelial (EC-1, EC-2) and HSPCs (HSPC-1, HSPC-2) of draculin:mCherry embryos. (D) Representative picture of a GFP+ neutrophil with JAGN1 detection and DAPI staining after immunostaining against JAGN1 and GFP on a 2 dpf transgenic tg(mpo:gfp) reporter embryo. DAPI, 4′,6-diamidino-2-phenylindole; Dm, Drosophila melanogaster; Dr, Danio rerio; Hs, Homo sapiens; Mm, Mus musculus; Ol, Oryzias latipes; Pt, Pan troglodytes; Rn, Rattus norvegicus. |
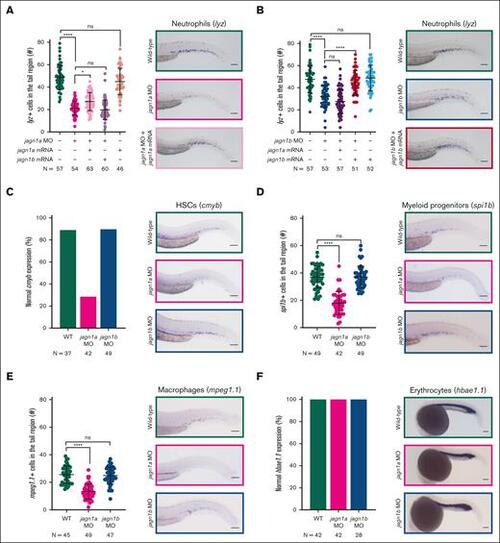
Jagn1a and Jagn1b have distinct and nonredundant functions in zebrafish hematopoiesis. (A-B) Effect of jagn1a (A) or jagn1b (B) downregulation on neutrophil counts and the rescue with jagn1a and jagn1b mRNA. The left panels show a quantitative analysis of the cells expressing the neutrophil marker lysozyme C (lyz), stained using WISH. The neutrophils were quantified after interfering with jagn1a (jagn1a MO) or jagn1b function (jagn1b MO), the subsequent rescue with full-length jagn1a or jagn1b mRNA, and jagn1a or jagn1b mRNA overexpression alone. The right panels show representative images of WISH for lysozyme C (lyz) in 2.25 dpf wild-type embryos or jagn1a and jagn1b morphants with or without overexpression of jagn1a or jagn1b mRNA. (C-F) Effect of jagn1a and jagn1b downregulation on other hematopoietic cells. The left panels show quantitative analyses of stained cells with WISH against hematopoietic cell-specific markers. The right panels show representative images of the WISH-stained embryos. The cells were stained against (C) cmyb, staining HSCs, (D) spi1b, staining myeloid progenitors, (E) mpeg1.1, staining macrophages in 2.25 dpf embryos and (F) hbae1.1 staining erythrocytes in 1 dpf embryos. (C,F) Comparison of the percentage (%) of normal gene expression pattern between wild-type, jagn1a and jagn1b morphants. (D-E) Numbers of stained cells in the hematopoietic region. Each dot in panels A-B,D-E represents the number of cells in the hematopoietic tissue of an individual 2.25 dpf embryo. Data are presented as mean ± standard deviation. The data represent the combined results from 2 to 3 independent experiments. N represents the total number of analyzed embryos. (A-E) Images were taken with 10× magnification. Scale bars represent 100 μm. (F) Images were taken with 8× magnification. Scale bars represent 100 μm. ns, not significant; ∗P < .05; ∗∗∗∗P < .0001. |

Expression of zebrafish Jagn1bΔT12-G14 results in neutropenia, without affecting other hematopoietic cells. (A) Top panel shows a schematic representation of identified CN-associated mutations in human JAGN1 gene. The bottom panel shows the tested mutations with the corresponding approach in this study. Note, to mimic the deletion (ΔT12-G14) we overexpressed jagn1bΔT12-G14 mRNA. Further, we targeted the transmembrane domain using CRISPR/Cas9 gene editing to introduce a truncating mutation. (B-C) Quantitative analysis of the cells expressing the neutrophil marker lysozyme C (lyz), stained with WISH in (B) jagn1b TM crispants and (C) after jagn1bΔT12-G14 overexpression alone or in combination with jagn1b morpholino. Each dot represents the number of cells in the hematopoietic tissue of a 2.25 dpf individual embryo. Data are presented as mean ± standard deviation. The data represent combined results from 2 independent experiments. N represents the total number of analyzed embryos. (D-E) Representative images of lyz+ neutrophils in (D) TM crispants and (E) after overexpression of jagn1bΔT12-G14 alone or in combination with jagn1b morpholino. Images were taken with 10× magnification. Scale bars represent 100 μm. (F-I) Effect of overexpression of jagn1bΔT12-G14 on other hematopoietic cells. The left panels show quantitative analyses of stained cells with WISH against hematopoietic cell-specific marker. The right panels show representative images of the WISH-stained embryos. The cells were stained against (F) cmyb, (G) spi1b, (H) mpeg1.1 all 3 in 2.25 dpf embryos and (I) hbae1.1 in 1 dpf embryos. (F,I) Comparison of the percentage (%) of normal gene expression pattern between wild-type embryos compared to that carrying jagn1bΔT12-G14 mutation. (G-H) Numbers of stained cells in the hematopoietic region. Each dot represents the number of cells in the hematopoietic tissue of an individual 2.25 dpf embryo. Data are presented as mean ± standard deviation. The data represent combined results from 2 independent experiments. N represents the total number of analyzed embryos. Pictures were taken with 8× to 10× magnification. Scale bars represent 100 μm. (J) Representative images of intracellular Jagn1 protein localization (GFP signal) after overexpression of gfp-jagn1bWT and gfp-jagn1bΔT12-G14 mRNA in draculin:mCherry-positive HSPCs at 20 hours postfertilization (hpf). ns, not significant; ∗∗P < .01; ∗∗∗∗P < .0001. |
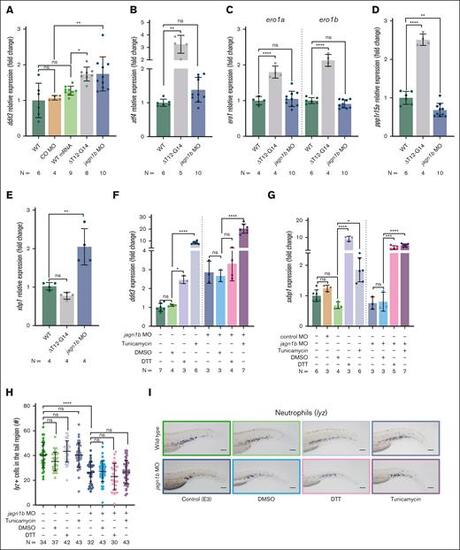
Deregulation of Jagn1b results in UPR activation, but UPR induction alone is not sufficient to induce neutropenia in zebrafish. (A-E) Relative expression levels (fold change) of UPR-associated genes measured with quantitative RT-PCR after interference with jagn1b by overexpressing jagn1bΔT12-G14 mRNA or inhibiting jagn1b with morpholino. Relative expression levels of (A) ddit3, coding the UPR marker Chop, (B) atf4, (C) ero1a and ero1b, (D) ppp1r15a, and (E) xbp1 were measured, corresponding groups are indicated. Expression levels were normalized to the housekeeping gene b-actin and fold change was calculated with respect to the expression levels of wild-type embryos. Each dot represents the value of the relative expression of 1 sample. Data are presented as mean ± standard deviation. The data represent combined results from 2 to 3 independent experiments. N represents the total number of analyzed complimentary DNA samples. (F-G) Relative expression (fold change) quantified by quantitative RT-PCR, normalized to the housekeeping gene b-actin and fold changes were calculated respect the expression levels of wild-type embryos of (F) UPR-marker ddit3 (G) and spliced xbp1 after UPR induction with tunicamycin (1 μg/mL), DTT (0.7 mM) or DMSO control (0.7%) alone or in combination with jagn1b morpholino. Data are presented as mean ± standard deviation. Each dot represents the value of relative expression of one sample. The data represent combined results from 2 to 3 independent experiments. N represents the total number of analyzed complimentary DNA samples. (H-I) Effect of chemically induced UPR on neutrophil counts. (H) Quantification of lyz+ neutrophils stained with WISH after UPR induction with tunicamycin (1 μg/mL), DTT (0.7 mM) or DMSO control (0.7%) alone or in combination with jagn1b morpholino. Each dot represents the number of cells in the hematopoietic tissue of a 2 dpf individual embryo after 24 hours of treatment. Data are presented as mean ± standard deviation. The data represent the combined results from 2 to 3 independent experiments. N represents the total number of analyzed embryos. (I) Representative images were taken with 10× magnification. Scale bars represents 100 μm. ns, not significant; ∗P < .05; ∗∗P < .01; ∗∗∗P < .001; ∗∗∗∗P < .0001. |
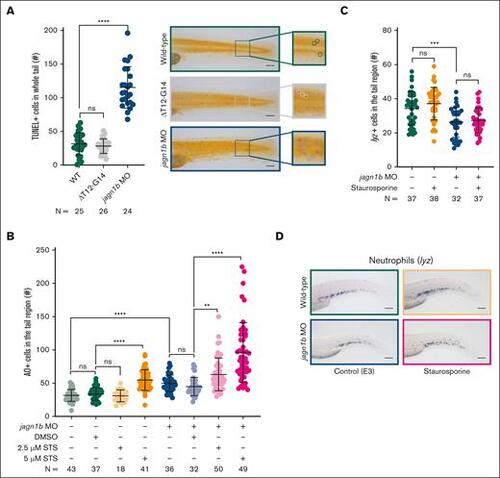
Apoptosis is increased upon jagn1b knockdown, but it is not sufficient to induce neutropenia. (A) Assessment of TUNEL+ apoptotic cells upon jagn1b interference. The left panel shows the quantification of the TUNEL+ cells in the whole trunk region of 2.25 dpf embryos after overexpression of jagn1bΔT12-G14 or jagn1b morpholino. Data shows mean and standard deviation. Each dot represents the number of TUNEL+ cells in the tail region of an individual embryo. The data represent the combined results from 2 independent experiments. N represents the total number of analyzed embryos. The right panel shows representative images of the tail region of wild-type, jagn1bΔT12-G14 embryos, and jagn1b morphants. Images were taken with 10× magnification. Scale bars represent 100 μm. The square at the right of each image represents a magnification of the marked tail region where each apoptotic cell is encircled. (B) Apoptosis induction in staurosporine-treated embryos using AO staining. Quantification of AO-positive apoptotic cells in the tail region of 2 dpf wild-type embryos and jagn1b morphants treated with DMSO, or staurosporine (STS). Each dot represents the number of AO+ cells in the tail region of an individual 2 dpf embryo. Data are presented as mean ± standard deviation. The data represent the combined results from 3 independent experiments. N represents the total number of analyzed embryos. (C-D) Effect of staurosporine-induced apoptosis on the neutrophil count. (C) Quantification of lyz+ neutrophils stained with WISH after apoptosis induction with staurosporine (5 μM) alone or combined with jagn1b morpholino. Data are presented as mean ± standard deviation. Each dot represents the number of stained cells in the hematopoietic region of an individual 2 dpf embryo. The data represent the combined results from 2 independent experiments. N represents the total number of analyzed embryos. (D) Representative images were taken with 10× magnification. Scale bars represent 100 μm. ns, not significant; ∗∗P < .01; ∗∗∗P < .001; ∗∗∗∗P < .0001. |
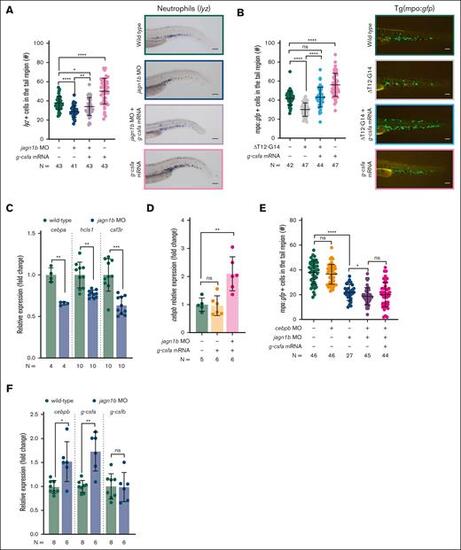
Jagn1b deregulation affects steady-state and emergency granulopoiesis. (A-B) G-csfa rescue after jagn1b interference. (A) G-csfa rescue in jagn1b morphants. The left panel shows the quantification of lyz+ neutrophils stained with WISH after g-csfa overexpression in 2.25 dpf wild-type embryos and jagn1b morphants. Right panel shows representative images taken with 10× magnification. Scale bars represent 100 μm. (B) G-csfa rescue in jagn1bΔT12-G14 embryos. The left panel shows the quantification of mpo:gfp+neutrophils after g-csfa overexpression in 2.25 dpf wild-type and jagn1bΔT12-G14 embryos. Right panel shows representative images taken with 8× magnification. Scale bars represent 100 μm. (C) Relative expression (fold change) of cebpa, hcls1 and csf3r in wild-type embryos and jagn1b morphants, quantified by quantitative RT-PCR, normalized to the housekeeping gene b-actin. Fold change was calculated in respect to the wild-type expression. (D) Relative expression (fold change) of cebpb after g-csfa overexpression in wild-type embryos and jagn1b morphants, quantified by quantitative RT-PCR, normalized to the housekeeping gene b-actin. Fold change was calculated in respect to the WT expression. (E) Quantification of mpo:gfp+ neutrophils after interfering with the function of jagn1b (jagn1b MO), cebpb (cebpb MO) and overexpression of g-csfa (g-csfa mRNA) alone or in combination. (F) Relative expression (fold change) of cebpb, g-csfa and g-csfb in wild-type embryos and jagn1b morphants, quantified by quantitative RT-PCR and normalized to b-actin. The fold change difference was calculated respective to the wild-type expression. (A-B,E) Each dot represents the number of cells in the hematopoietic tissue of a 2.25 dpf individual embryo. Data are presented as mean ± standard deviation. The data represent combined results from 2-3 independent experiments. N represents the total number of analyzed embryos. (C,D,F) Each dot represents the relative expression of 1 analyzed sample. Data are presented as mean ± standard deviation. The data represent combined results from 2 to 3 independent experiments. N represents the total number of analyzed biological samples. ns, not significant; ∗P < .05; ∗∗P < .01; ∗∗∗P < .001; ∗∗∗∗P < .0001. |