
Fig. 6
- ID
- ZDB-FIG-240801-33
- Publication
- Doll et al., 2024 - A JAGN1-associated severe congenital neutropenia zebrafish model revealed an altered G-CSFR signaling and UPR activation
- Other Figures
- All Figure Page
- Back to All Figure Page
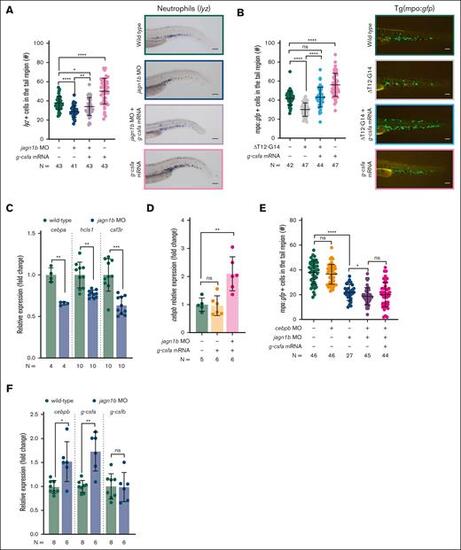
Jagn1b deregulation affects steady-state and emergency granulopoiesis. (A-B) G-csfa rescue after jagn1b interference. (A) G-csfa rescue in jagn1b morphants. The left panel shows the quantification of lyz+ neutrophils stained with WISH after g-csfa overexpression in 2.25 dpf wild-type embryos and jagn1b morphants. Right panel shows representative images taken with 10× magnification. Scale bars represent 100 μm. (B) G-csfa rescue in jagn1bΔT12-G14 embryos. The left panel shows the quantification of mpo:gfp+neutrophils after g-csfa overexpression in 2.25 dpf wild-type and jagn1bΔT12-G14 embryos. Right panel shows representative images taken with 8× magnification. Scale bars represent 100 μm. (C) Relative expression (fold change) of cebpa, hcls1 and csf3r in wild-type embryos and jagn1b morphants, quantified by quantitative RT-PCR, normalized to the housekeeping gene b-actin. Fold change was calculated in respect to the wild-type expression. (D) Relative expression (fold change) of cebpb after g-csfa overexpression in wild-type embryos and jagn1b morphants, quantified by quantitative RT-PCR, normalized to the housekeeping gene b-actin. Fold change was calculated in respect to the WT expression. (E) Quantification of mpo:gfp+ neutrophils after interfering with the function of jagn1b (jagn1b MO), cebpb (cebpb MO) and overexpression of g-csfa (g-csfa mRNA) alone or in combination. (F) Relative expression (fold change) of cebpb, g-csfa and g-csfb in wild-type embryos and jagn1b morphants, quantified by quantitative RT-PCR and normalized to b-actin. The fold change difference was calculated respective to the wild-type expression. (A-B,E) Each dot represents the number of cells in the hematopoietic tissue of a 2.25 dpf individual embryo. Data are presented as mean ± standard deviation. The data represent combined results from 2-3 independent experiments. N represents the total number of analyzed embryos. (C,D,F) Each dot represents the relative expression of 1 analyzed sample. Data are presented as mean ± standard deviation. The data represent combined results from 2 to 3 independent experiments. N represents the total number of analyzed biological samples. ns, not significant; ∗P < .05; ∗∗P < .01; ∗∗∗P < .001; ∗∗∗∗P < .0001. |