
|
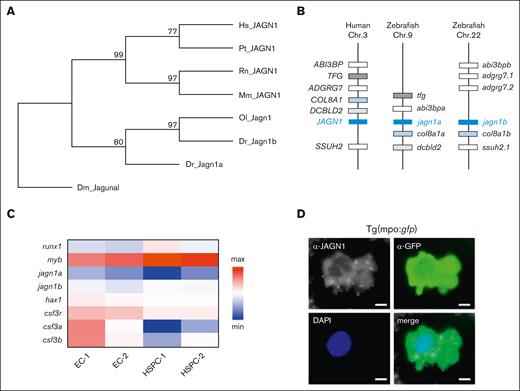
Fig. 1 The evolution of JAGN1 gene and the expression patterns of its homologs in zebrafish. (A) A neighbor-joining phylogenetic tree of JAGN1 proteins performed with 1000 bootstrap replications. Branch labels represent consensus support in percentage. (B) Schematic comparison of genomic synteny between human JAGN1 and zebrafish jagn1a and jagn1b loci. (C) Heat map representing gene expression levels in sorted endothelial (EC-1, EC-2) and HSPCs (HSPC-1, HSPC-2) of draculin:mCherry embryos. (D) Representative picture of a GFP+ neutrophil with JAGN1 detection and DAPI staining after immunostaining against JAGN1 and GFP on a 2 dpf transgenic tg(mpo:gfp) reporter embryo. DAPI, 4′,6-diamidino-2-phenylindole; Dm, Drosophila melanogaster; Dr, Danio rerio; Hs, Homo sapiens; Mm, Mus musculus; Ol, Oryzias latipes; Pt, Pan troglodytes; Rn, Rattus norvegicus.