
Fig. 2
- ID
- ZDB-FIG-240801-29
- Publication
- Doll et al., 2024 - A JAGN1-associated severe congenital neutropenia zebrafish model revealed an altered G-CSFR signaling and UPR activation
- Other Figures
- All Figure Page
- Back to All Figure Page
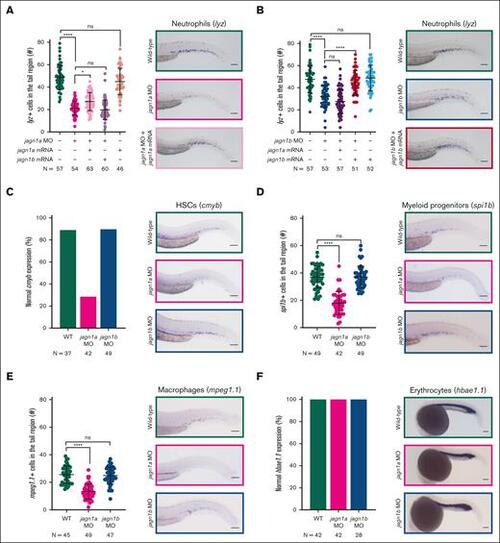
Jagn1a and Jagn1b have distinct and nonredundant functions in zebrafish hematopoiesis. (A-B) Effect of jagn1a (A) or jagn1b (B) downregulation on neutrophil counts and the rescue with jagn1a and jagn1b mRNA. The left panels show a quantitative analysis of the cells expressing the neutrophil marker lysozyme C (lyz), stained using WISH. The neutrophils were quantified after interfering with jagn1a (jagn1a MO) or jagn1b function (jagn1b MO), the subsequent rescue with full-length jagn1a or jagn1b mRNA, and jagn1a or jagn1b mRNA overexpression alone. The right panels show representative images of WISH for lysozyme C (lyz) in 2.25 dpf wild-type embryos or jagn1a and jagn1b morphants with or without overexpression of jagn1a or jagn1b mRNA. (C-F) Effect of jagn1a and jagn1b downregulation on other hematopoietic cells. The left panels show quantitative analyses of stained cells with WISH against hematopoietic cell-specific markers. The right panels show representative images of the WISH-stained embryos. The cells were stained against (C) cmyb, staining HSCs, (D) spi1b, staining myeloid progenitors, (E) mpeg1.1, staining macrophages in 2.25 dpf embryos and (F) hbae1.1 staining erythrocytes in 1 dpf embryos. (C,F) Comparison of the percentage (%) of normal gene expression pattern between wild-type, jagn1a and jagn1b morphants. (D-E) Numbers of stained cells in the hematopoietic region. Each dot in panels A-B,D-E represents the number of cells in the hematopoietic tissue of an individual 2.25 dpf embryo. Data are presented as mean ± standard deviation. The data represent the combined results from 2 to 3 independent experiments. N represents the total number of analyzed embryos. (A-E) Images were taken with 10× magnification. Scale bars represent 100 μm. (F) Images were taken with 8× magnification. Scale bars represent 100 μm. ns, not significant; ∗P < .05; ∗∗∗∗P < .0001. |