
|
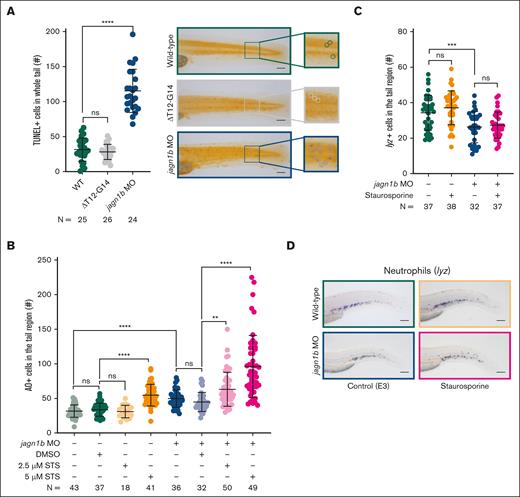
Fig. 5 Apoptosis is increased upon jagn1b knockdown, but it is not sufficient to induce neutropenia. (A) Assessment of TUNEL+ apoptotic cells upon jagn1b interference. The left panel shows the quantification of the TUNEL+ cells in the whole trunk region of 2.25 dpf embryos after overexpression of jagn1bΔT12-G14 or jagn1b morpholino. Data shows mean and standard deviation. Each dot represents the number of TUNEL+ cells in the tail region of an individual embryo. The data represent the combined results from 2 independent experiments. N represents the total number of analyzed embryos. The right panel shows representative images of the tail region of wild-type, jagn1bΔT12-G14 embryos, and jagn1b morphants. Images were taken with 10× magnification. Scale bars represent 100 μm. The square at the right of each image represents a magnification of the marked tail region where each apoptotic cell is encircled. (B) Apoptosis induction in staurosporine-treated embryos using AO staining. Quantification of AO-positive apoptotic cells in the tail region of 2 dpf wild-type embryos and jagn1b morphants treated with DMSO, or staurosporine (STS). Each dot represents the number of AO+ cells in the tail region of an individual 2 dpf embryo. Data are presented as mean ± standard deviation. The data represent the combined results from 3 independent experiments. N represents the total number of analyzed embryos. (C-D) Effect of staurosporine-induced apoptosis on the neutrophil count. (C) Quantification of lyz+ neutrophils stained with WISH after apoptosis induction with staurosporine (5 μM) alone or combined with jagn1b morpholino. Data are presented as mean ± standard deviation. Each dot represents the number of stained cells in the hematopoietic region of an individual 2 dpf embryo. The data represent the combined results from 2 independent experiments. N represents the total number of analyzed embryos. (D) Representative images were taken with 10× magnification. Scale bars represent 100 μm. ns, not significant; ∗∗P < .01; ∗∗∗P < .001; ∗∗∗∗P < .0001.