
- Title
-
Integrated spatial metabolomics and transcriptomics decipher the hepatoprotection mechanisms of wedelolactone and demethylwedelolactone on non-alcoholic fatty liver disease
- Authors
- Chen, P., Zhu, Z., Geng, H., Cui, X., Han, Y., Wang, L., Zhang, Y., Lu, H., Wang, X., Zhang, Y., Sun, C.
- Source
- Full text @ J Pharm Anal
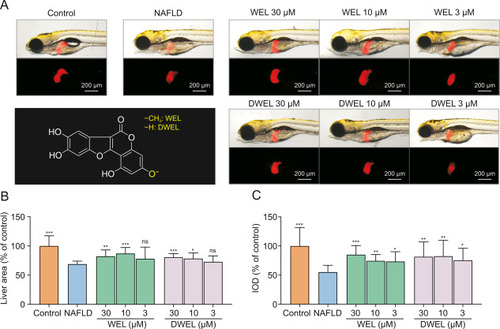
Effects of wedelolactone (WEL) and demethylwedelolactone (DWEL) on thioacetamide (TAA)-damaged zebrafish larvae. (A) The structure of WEL and DWEL, and their hepatoprotection against TAA-damaged zebrafish larvae. (B) Quantification of liver area in each group. (C) Quantitative analysis of the liver fluorescence intensity. Data are presented as mean ± standard deviation (SD) (n = 10). ∗P < 0.05, ∗∗P < 0.01, ∗∗∗P < 0.001, ns: no significance. NAFLD: non-alcoholic fatty liver disease; IOD: integrated optical density. |
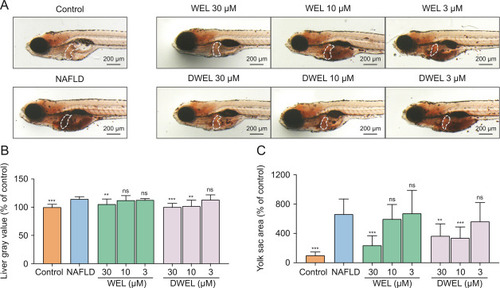
Effects of wedelolactone (WEL) and demethylwedelolactone (DWEL) on lipids accumulation in zebrafish liver. (A) Oil red O staining of zebrafish larvae. (B) Staining quantitation of zebrafish liver of each group. (C) Quantitative analysis of yolk area in zebrafish larvae. Data are presented as mean ± standard deviation (SD) (n = 10). ∗P < 0.05, ∗∗P < 0.01, ∗∗∗P < 0.001, ns: no significance. The white dotted lines outline the liver area. |
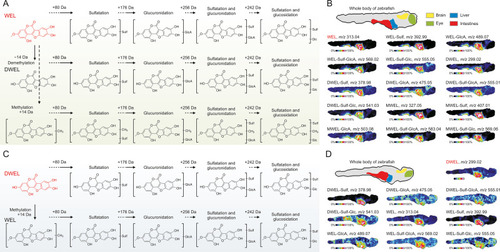
The metabolism and spatial signatures of wedelolactone (WEL) and demethylwedelolactone (DWEL) in zebrafish. (A) Metabolism pathway of WEL and the structural inferences of its metabolites. (B) Mass spectrometry (MS) images depicting the spatial distribution of WEL and its metabolites in zebrafish whole-body section. (C) Metabolism pathway of DWEL and the structural inferences of its metabolites. (D) MS images depicting the spatial distribution of DWEL and its metabolites in zebrafish. WEL-Sulf: sulfated wedelolactone; WEL-GlcA: glucuronidated wedelolactone; WEL-Sulf-GlcA: sulfated-glucuronidated wedelolactone; WEL-Sulf-Glc: sulfated-glucosidated wedelolactone; DWEL-Sulf: sulfated demethylwedelolactone; DWEL-GlcA: glucuronidated demethylwedelolactone; DWEL-Sulf-GlcA: sulfated-glucuronidated demethylwedelolactone; DWEL-Sulf-Glc: sulfated-glucosidated demethylwedelolactone; MWEL: methylated wedelolactone; MWEL-Sulf: methylated and sulfated wedelolactone; MWEL-GlcA: methylated and glucuronidated wedelolactone; MWEL-Sulf-GlcA: methylated, sulfated and glucuronidated wedelolactone; MWEL-Sulf-Glc: methylated, sulfated and glucosidated wedelolactone. |
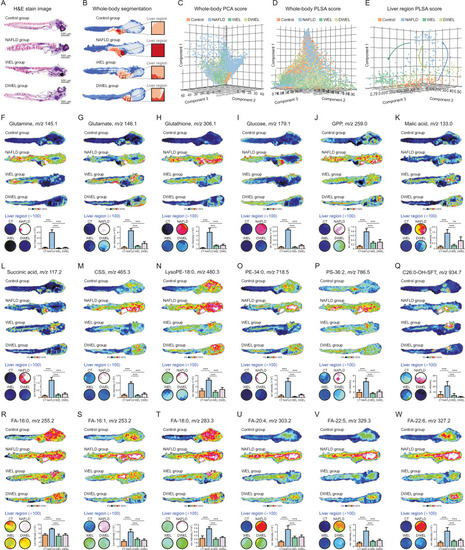
Spatial metabolomics screened out discriminatory metabolites modulated by wedelolactone (WEL) and demethylwedelolactone (DWEL) on non-alcoholic fatty liver disease (NAFLD). (A) The hematoxylin and eosin (H&E) stain image for model, WEL or DWEL, and normal groups. (B) Metabolite-driven whole-body segmentation analysis based on the matrix-assisted laser desorption/ionization-mass spectrometry imaging (MALDI-MSI) data. (C) Whole-body principal component analysis (PCA). (D) Whole-body probabilistic latent semantic analysis (PLSA). (E) Liver specific PLSA analysis. (F–W) MALDI-MS images and expression levels of altered metabolites in zebrafish whole-body section and liver region. ∗∗∗P < 0.001. CT: control; GPP: glucose phosphate; CSS: cholesterol sulfate; lysoPE: lyso-phosphatidylethanolamine; PE: phosphatidylethanolamine; C26:0-OH-SFT: C26:0-OH sulfatide; PS: phosphatidylserine; LysoPC: lyso-phosphatidylcholine; FAs: fatty acids. |
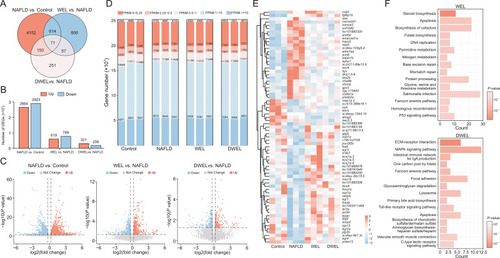
Wedelolactone (WEL) and demethylwedelolactone (DWEL) extensively altered gene expression patterns in zebrafish liver. (A) Venn diagram analysis of the total differentially expressed genes (DEGs) in three comparisons: non-alcoholic fatty liver disease (NAFLD) group vs. control group, WEL treatment groups vs. NAFLD group and DWEL treatment groups vs. NAFLD group. (B, C) The statistics of DEGs that up- and down-regulated were shown by colored columns (B) and volcano plot (C). (D) Stacking histogram of fragments per kilobase of transcript per million mapped reads (FPKM) values of the genes in each sample. (E) Heatmap of the 71 DEGs overlapped among the three comparisons. (F) Kyoto Encyclopedia of Genes and Genomes (KEGG) pathway enrichment analysis of DEGs in WEL and DWEL treatment groups vs. NAFLD group. |

The integrated analysis of transcriptomic and metabolomic profiles following wedelolactone (WEL) and demethylwedelolactone (DWEL) treatment. (A) Single-sample gene set enrichment analysis (ssGSEA) of the key metabolic pathway across each sample. (B) Gene set enrichment analysis (GSEA) of steroid biosynthesis and fatty acid elongation in WEL and DWEL treatment group vs. non-alcoholic fatty liver disease (NAFLD) group. (C) The biological processes of steroid synthesis, fatty acid metabolism, and glutathione metabolism, and the crucial genes involved. (D) The relative mRNA levels of genes in essential metabolic pathways determined by quantitative real-time PCR (qRT-PCR). Data are presented as mean ± standard deviation (SD) (n = 10). ∗P < 0.05, ∗∗∗P < 0.001, ns: no significance. NES: normalized enrichment score; FDR: false discovery rate; TAA: thioacetamide; farnesyl-PP: farnesyl pyrophosphate. |