
Fig. 5
- ID
- ZDB-FIG-240529-32
- Publication
- Chen et al., 2024 - Integrated spatial metabolomics and transcriptomics decipher the hepatoprotection mechanisms of wedelolactone and demethylwedelolactone on non-alcoholic fatty liver disease
- Other Figures
- All Figure Page
- Back to All Figure Page
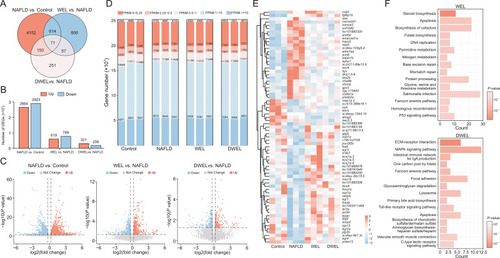
Wedelolactone (WEL) and demethylwedelolactone (DWEL) extensively altered gene expression patterns in zebrafish liver. (A) Venn diagram analysis of the total differentially expressed genes (DEGs) in three comparisons: non-alcoholic fatty liver disease (NAFLD) group vs. control group, WEL treatment groups vs. NAFLD group and DWEL treatment groups vs. NAFLD group. (B, C) The statistics of DEGs that up- and down-regulated were shown by colored columns (B) and volcano plot (C). (D) Stacking histogram of fragments per kilobase of transcript per million mapped reads (FPKM) values of the genes in each sample. (E) Heatmap of the 71 DEGs overlapped among the three comparisons. (F) Kyoto Encyclopedia of Genes and Genomes (KEGG) pathway enrichment analysis of DEGs in WEL and DWEL treatment groups vs. NAFLD group. |