
Fig. 4
- ID
- ZDB-FIG-240529-31
- Publication
- Chen et al., 2024 - Integrated spatial metabolomics and transcriptomics decipher the hepatoprotection mechanisms of wedelolactone and demethylwedelolactone on non-alcoholic fatty liver disease
- Other Figures
- All Figure Page
- Back to All Figure Page
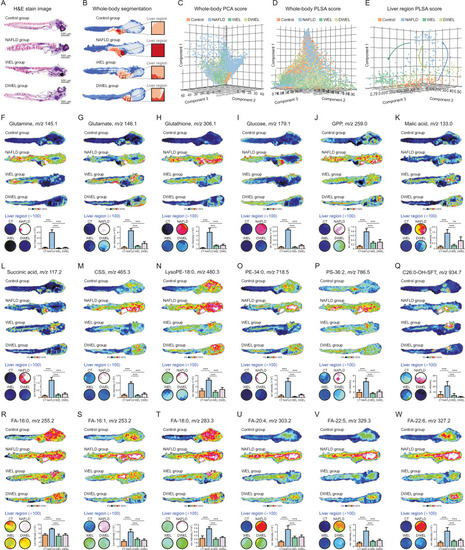
Spatial metabolomics screened out discriminatory metabolites modulated by wedelolactone (WEL) and demethylwedelolactone (DWEL) on non-alcoholic fatty liver disease (NAFLD). (A) The hematoxylin and eosin (H&E) stain image for model, WEL or DWEL, and normal groups. (B) Metabolite-driven whole-body segmentation analysis based on the matrix-assisted laser desorption/ionization-mass spectrometry imaging (MALDI-MSI) data. (C) Whole-body principal component analysis (PCA). (D) Whole-body probabilistic latent semantic analysis (PLSA). (E) Liver specific PLSA analysis. (F–W) MALDI-MS images and expression levels of altered metabolites in zebrafish whole-body section and liver region. ∗∗∗P < 0.001. CT: control; GPP: glucose phosphate; CSS: cholesterol sulfate; lysoPE: lyso-phosphatidylethanolamine; PE: phosphatidylethanolamine; C26:0-OH-SFT: C26:0-OH sulfatide; PS: phosphatidylserine; LysoPC: lyso-phosphatidylcholine; FAs: fatty acids. |