
- Title
-
Aquaporins enriched in endothelial vacuole membrane regulate the diameters of microvasculature in hyperglycemia
- Authors
- Chen, C., Qin, Y., Xu, Y., Wang, X., Lei, W., Shen, X., Chen, L., Wang, L., Gong, J., Wang, Y., Hu, S., Liu, D.
- Source
- Full text @ Cardiovasc. Res.
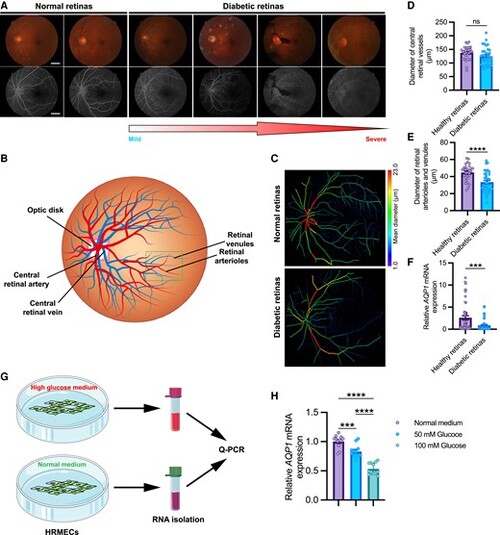
AQP1 is low expressed in retina samples from diabetic patients. A, Representative fundus images (upper) and fluorescein angiography (lower) of normal retinas and retinas with diabetic retinopathy (DR) at different stages (from mild to severe). Scale bars, 1 mm. B, Representative sketch of human retinal vessels. C, Representative images of the reconstructed normal and diabetic retinal vessels. D and E, Diameters of the central retinal vessels (central retinal artery and vein) and the branching retinal vessels (retinal arterioles and venules). Each data point in D represent the mean diameter of central retinal vessels of an individual human sample, and each data point in E represent the mean diameter of the branching retinal vessels of an individual human sample. Data are shown as mean ± s.e.m. A two-tailed, unpaired Student's t-test is applied. ns, not significant. ****P < 0.0001. F, Quantification of AQP1 expression in healthy (n = 49) and diabetic (n = 54) retina samples. Each data point represents the AQP1 expression in an individual sample. Data are shown as mean ± s.e.m. A two-tailed, unpaired Student's t-test is applied. ***P < 0.001. G, Schematic representation of cell experiment. HRMECs were cultured in normal and high glucose mediums, respectively. The RNAs of each group were separately isolated and quantified for AQP1 expression. H, Quantification of AQP1 expression in HRMECs cultured in normal and high glucose medium. One-way ANOVA analysis is applied. ****P < 0.0001. |
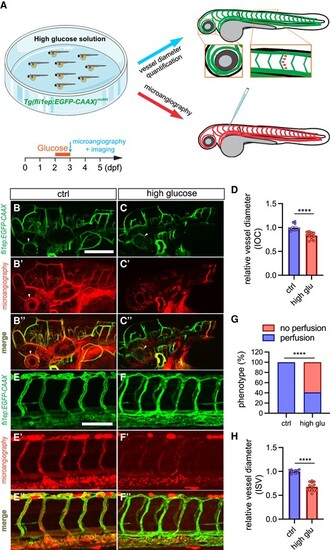
High glucose treatment affects vascular diameter in zebrafish. A, Schematic representation of establishing zebrafish hyperglycaemia/DM model. Zebrafish embryos are immersed in high glucose solution (4% D-glucose w/v) from 2 to 3 dpf. Microangiography and confocal imaging are performed afterward. The arrowheads indicate the positions for vessel diameter measurement on IOC or ISV. B-C’’, Representative confocal images of IOC phenotypes in 3-dpf Tg(fli1ep:EGFP-CAAX)ntu666 transgenic line with (n = 22) or without (n = 14) glucose treatment. The arrowheads indicate the IOC. D, Quantification of IOC diameter. E-F’’, Representative confocal images of ISV phenotypes in 3-dpf Tg(fli1ep:EGFP-CAAX)ntu666 transgenic line with (n = 22) or without (n = 14) glucose treatment. G, The incidence of normal and non-perfused ISVs in 3-dpf Tg(fli1ep:EGFP-CAAX)ntu666 transgenic line with (n = 22) or without (n = 14) glucose treatment. H, Quantification of ISV diameter. Each data point in D and H represents an individual vessel diameter measurement of IOC or ISV. Five fishes are analysed for control and high glucose treatment. Data are shown as mean ± s.e.m. A two-tailed, unpaired Student's t-test is applied. ***P < 0.001. ****P < 0.0001. Scale bars, 100 μm. |
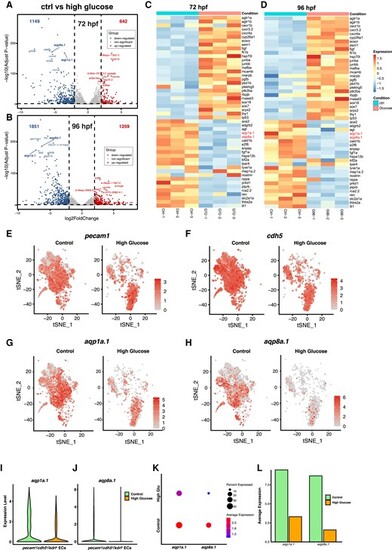
Whole-genome and single-cell transcriptomic profiling of Tg(fli1ep:EGFP-CAAX)ntu666 transgenic line with or without glucose treatment. A and B, Volcano plots of down-regulated genes, up-regulated genes, and unchanged genes in the high glucose-treated group vs. the control group at 72 and 96 hpf, respectively. C and D, Heatmaps based on bulk RNA-seq data represent the expression changes of the vascular-related DEGs. Zebrafish aqp1a.1 and aqp8a.1 are down-regulated upon high glucose treatment. E-H, t-SNE plots demonstrate the relative distributions of pecam1, cdh5, aqp1a.1, and aqp8a.1 across pecam1+/cdh5+/kdrl+ cells in control and high glucose-treated groups. I and J, Expression levels of aqp1a.1, and aqp8a.1 across pecam1+/cdh5+/kdrl+ cells in control and high glucose-treated groups. K and L, Percentages and average expressions of pecam1+/cdh5+/kdrl+ cells expressed aqp1a.1, and aqp8a.1, respectively. |
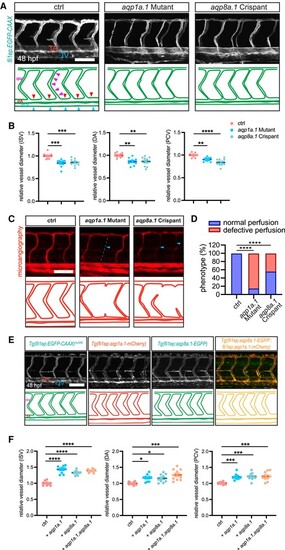
Effects of aqp1a.1/aqp8a.1 loss- and gain-of-function on blood vessel diameters. A and B, Knock-out of EC-enriched aquaporins (aqp1a.1 or aqp8a.1) leads to the reduction of vascular diameter in zebrafish. A, Confocal images of ISV phenotypes in 48-hpf Tg(fli1ep:EGFP-CAAX)ntu666 control embryos (n = 18), aqp1a.1-knockout embryos (n = 18), and aqp8a.1 crispants (n = 30). The square brackets indicate artery (A) and vein (V), respectively. The arrowheads in the representative sketch indicate the positions for vessel diameter measurement for ISV, DA, and PCV, respectively. B, Quantification of the diameters of ISV, DA, and PCV. Each data point represents an individual vessel diameter measurement of ISV, DA, and PCV. Five fishes are analysed for each group. Data are shown as mean ± s.e.m. One-way ANOVA analysis is applied. C, Microangiography of the trunk region in 72-hpf Tg(fli1ep:EGFP-CAAX)ntu666 control embryos (n = 18), aqp1a.1-knockout embryos (n = 18), and aqp8a.1 crispants (n = 30). The arrowheads indicate the perfusion-deficient ISVs. D, The incidence of normal and defective perfused ISVs in 72-hpf Tg(fli1ep:EGFP-CAAX)ntu666 control embryos (n = 18), aqp1a.1-knockout embryos (n = 18), and aqp8a.1 crispants (n = 30). One-way ANOVA analysis is applied. E and F, Overexpression of EC-enriched aquaporins (aqp1a.1 or aqp8a.1) in ECs results in vessel lumen enlargement in zebrafish. E, Confocal images of ISV phenotypes in 48-hpf Tg(fli1ep:EGFP-CAAX)ntu666 transgenic line (control, n = 18), Tg(fli1ep:aqp1a.1-mCherry)ntu667 transgenic line (aqp1a.1 overexpression, n = 25), Tg(fli1ep:aqp8a.1-EGFP)ntu668 transgenic line (aqp8a.1 overexpression, n = 23), and Tg(fli1ep:aqp8a.1-EGFP::fli1ep:aqp1a.1-mCherry) double transgenic line (aqp1a.1 and aqp8a.1 co-overexpression, n = 25). F, Quantification of the diameters of ISV, DA, and PCV. Each data point represents an individual vessel diameter measurement of ISV, DA, and PCV. Five fishes are analysed for each group. Data are shown as mean ± s.e.m. One-way ANOVA analysis is applied. *P < 0.05. **P < 0.01. ****P < 0.0001. Scale bars, 100 μm. |
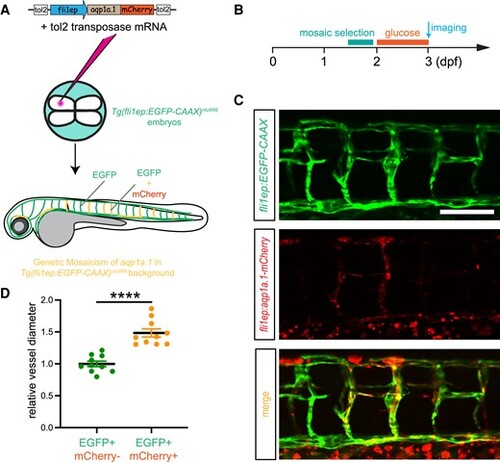
Overexpression of zebrafish aqp1a.1 rescues hyperglycaemia-caused narrowing of vascular diameter. A, Schematic representation of establishment of aqp1a.1-overexpressed transgenic line under Tg(fli1ep:EGFP-CAAX)ntu666 background. DNA construct and Tol2 transposase mRNA are co-injected at the 4-cell stage to establish a chimaera line, in which the mCherry-labelled Aqp1a.1 is mosaically expressed in the vascular system. B, Embryos are selected and immersed into high glucose solution from 2 to 3 dpf prior to imaging. C, Representative confocal images of ISVs in 3-dpf Tg(fli1ep:EGFP-CAAX::fli1ep:apq1.1-mCherry) double transgenic line (n = 40). D, Quantification of the lumen diameters in ISVs with or without Aqp1a.1 expression. Each data point represents an individual vessel diameter measurement of ISV, DA, and PCV. Five fishes are analysed for each group. Data are shown as mean ± s.e.m. A two-tailed, unpaired Student's t-test is applied. ****P < 0.0001. Scale bar, 100 μm. |

AQP1 deletion does not affect EC differentiation from H1 stem cells but inhibits tube formation of the derived ECs. A, Schematic representation of the epiCRISPR system for AQP1 gene knock-out in H1 cell line. The vector contains a U6 promoter-driven gRNA scaffold, an EF1a promoter-driven Cas9 fused to puromycin-resistance gene and GFP with P2A peptides, and OriP/EBNA1 elements for the plasmid replication in eukaryotes. The epiCRISPR vector can replicate in H1 cells and can be partitioned into daughter cells. B-D, Flow cytometry analyses showing the percentages of cells that express CD31 and CD144 endothelial markers in ECs derived from H1 cell line (B) and two AQP1-knockout H1 cell lines, ΔAQP1-1-H1 (C) and ΔAQP1-2-H1 (D). E-G, Q-PCR analyses confirming the gene expressions of AQP1, CD31, and CD144 in ECs derived from H1 (E), ΔAQP1-1-H1 (F), and ΔAQP1-2-H1 (G) cell lines. H-J, Representative microscopy images showing the tube formation of ECs derived from H1 cell line (H), ΔAQP1-1-H1 (I), and ΔAQP1-2-H1 (J) cell lines. The derived ECs are seeded on the Matrigel for 6 h before being subjected to analysis. The number of junctions, the total length of tubes, and total mesh size of the vascular network formed by ECs derived from H1 (n = 6), ΔAQP1-1-H1 (n = 6), and ΔAQP1-2-H1 (n = 6) cells are shown in K, L, and M, respectively. Data are shown as mean ± s.e.m. One-way ANOVA analysis is applied. ns, not significant. *P < 0.05, **P < 0.01, ***P < 0.001, ****P < 0.0001. Scale bar, 100 μm. |
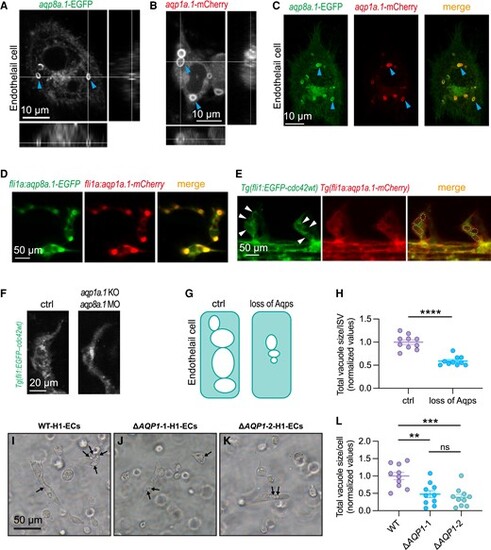
Endothelial AQP facilitates intracellular vacuole formation in ECs in vitro and in vivo. A-C, Fluorescently labelled Aqp1a.1 and Aqp8a.1 are expressed on the surface of cytoplasmic vacuoles (arrowheads) in HUVECs. Subpanels at the bottom and right of A and B are cross sections of the intracellular vacuoles. C, Aqp1a.1 and Aqp8a.1 co-localize at the intracellular vacuoles. Scale bars, 10 μm. D, EGFP-labelled Aqp1a.1 and mCherry-labelled Aqp8a.1 are expressed and co-localized at the intracellular vacuoles in zebrafish ISVs. E, Confocal imaging of zebrafish ISVs in Tg(fli1:EGFP-cdc42wt::fli1a:aqp1a.1-mCherry) double transgenic line, in which the EGFP-labelled Cdc42 protein marks the vacuolar structures (arrowheads), and Aqp1a.1 is labelled by mCherry. Aqp1a.1 co-localizes with intracellular vacuoles (dashed circles) (n = 20). Scale bars, 50 μm. F, Knock-out aqp1a.1 and knock-down aqp8a.1 in zebrafish lead to defective vascular lumen formation and reduced intracellular vacuoles in ISVs (n = 19). Scale bars, 20 μm. G, Schematic representation of intracellular vacuole changes upon loss of Aqps. H, Quantification of the total size of intracellular vacuoles in zebrafish ISVs. Each point represents the total size of intracellular vacuoles in an individual ISV. Five fishes are analysed for each group. Data are shown as mean ± s.e.m. A two-tailed, unpaired Student's t-test is applied. **P < 0.01. I-J, Representative images of intracellular vacuoles (arrows) in ECs derived H1 cell line (I), ΔAQP1-1-H1 (J) and ΔAQP1-2-H1 (K) cell lines. Scale bars, 50 μm. L, Quantification of the total size of intracellular vacuoles in cultured ECs. Each point represents the size of intracellular vacuoles per cell. One-way ANOVA analysis is applied. ns, not significant. **P < 0.01, ***P < 0.001. |