
|
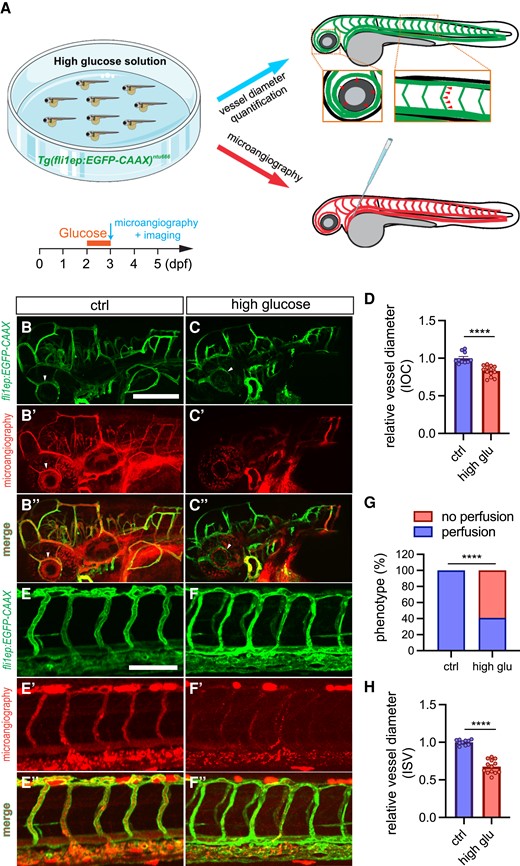
Fig. 2 High glucose treatment affects vascular diameter in zebrafish. A, Schematic representation of establishing zebrafish hyperglycaemia/DM model. Zebrafish embryos are immersed in high glucose solution (4% D-glucose w/v) from 2 to 3 dpf. Microangiography and confocal imaging are performed afterward. The arrowheads indicate the positions for vessel diameter measurement on IOC or ISV. B-C’’, Representative confocal images of IOC phenotypes in 3-dpf Tg(fli1ep:EGFP-CAAX)ntu666 transgenic line with (n = 22) or without (n = 14) glucose treatment. The arrowheads indicate the IOC. D, Quantification of IOC diameter. E-F’’, Representative confocal images of ISV phenotypes in 3-dpf Tg(fli1ep:EGFP-CAAX)ntu666 transgenic line with (n = 22) or without (n = 14) glucose treatment. G, The incidence of normal and non-perfused ISVs in 3-dpf Tg(fli1ep:EGFP-CAAX)ntu666 transgenic line with (n = 22) or without (n = 14) glucose treatment. H, Quantification of ISV diameter. Each data point in D and H represents an individual vessel diameter measurement of IOC or ISV. Five fishes are analysed for control and high glucose treatment. Data are shown as mean ± s.e.m. A two-tailed, unpaired Student's t-test is applied. ***P < 0.001. ****P < 0.0001. Scale bars, 100 μm.