
|
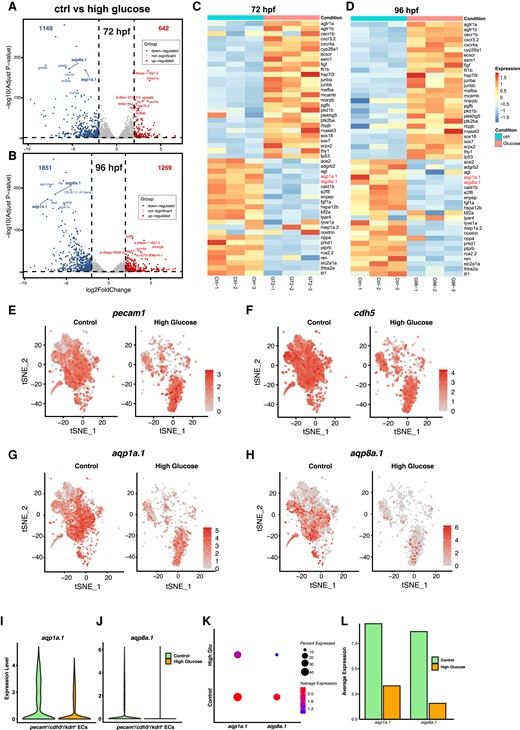
Fig. 3 Whole-genome and single-cell transcriptomic profiling of Tg(fli1ep:EGFP-CAAX)ntu666 transgenic line with or without glucose treatment. A and B, Volcano plots of down-regulated genes, up-regulated genes, and unchanged genes in the high glucose-treated group vs. the control group at 72 and 96 hpf, respectively. C and D, Heatmaps based on bulk RNA-seq data represent the expression changes of the vascular-related DEGs. Zebrafish aqp1a.1 and aqp8a.1 are down-regulated upon high glucose treatment. E-H, t-SNE plots demonstrate the relative distributions of pecam1, cdh5, aqp1a.1, and aqp8a.1 across pecam1+/cdh5+/kdrl+ cells in control and high glucose-treated groups. I and J, Expression levels of aqp1a.1, and aqp8a.1 across pecam1+/cdh5+/kdrl+ cells in control and high glucose-treated groups. K and L, Percentages and average expressions of pecam1+/cdh5+/kdrl+ cells expressed aqp1a.1, and aqp8a.1, respectively.