
Fig. 4
- ID
- ZDB-FIG-240731-24
- Publication
- Chen et al., 2024 - Aquaporins enriched in endothelial vacuole membrane regulate the diameters of microvasculature in hyperglycemia
- Other Figures
- All Figure Page
- Back to All Figure Page
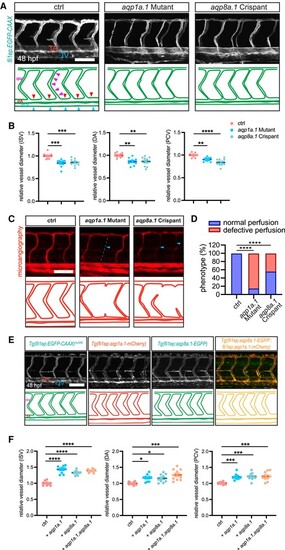
Effects of aqp1a.1/aqp8a.1 loss- and gain-of-function on blood vessel diameters. A and B, Knock-out of EC-enriched aquaporins (aqp1a.1 or aqp8a.1) leads to the reduction of vascular diameter in zebrafish. A, Confocal images of ISV phenotypes in 48-hpf Tg(fli1ep:EGFP-CAAX)ntu666 control embryos (n = 18), aqp1a.1-knockout embryos (n = 18), and aqp8a.1 crispants (n = 30). The square brackets indicate artery (A) and vein (V), respectively. The arrowheads in the representative sketch indicate the positions for vessel diameter measurement for ISV, DA, and PCV, respectively. B, Quantification of the diameters of ISV, DA, and PCV. Each data point represents an individual vessel diameter measurement of ISV, DA, and PCV. Five fishes are analysed for each group. Data are shown as mean ± s.e.m. One-way ANOVA analysis is applied. C, Microangiography of the trunk region in 72-hpf Tg(fli1ep:EGFP-CAAX)ntu666 control embryos (n = 18), aqp1a.1-knockout embryos (n = 18), and aqp8a.1 crispants (n = 30). The arrowheads indicate the perfusion-deficient ISVs. D, The incidence of normal and defective perfused ISVs in 72-hpf Tg(fli1ep:EGFP-CAAX)ntu666 control embryos (n = 18), aqp1a.1-knockout embryos (n = 18), and aqp8a.1 crispants (n = 30). One-way ANOVA analysis is applied. E and F, Overexpression of EC-enriched aquaporins (aqp1a.1 or aqp8a.1) in ECs results in vessel lumen enlargement in zebrafish. E, Confocal images of ISV phenotypes in 48-hpf Tg(fli1ep:EGFP-CAAX)ntu666 transgenic line (control, n = 18), Tg(fli1ep:aqp1a.1-mCherry)ntu667 transgenic line (aqp1a.1 overexpression, n = 25), Tg(fli1ep:aqp8a.1-EGFP)ntu668 transgenic line (aqp8a.1 overexpression, n = 23), and Tg(fli1ep:aqp8a.1-EGFP::fli1ep:aqp1a.1-mCherry) double transgenic line (aqp1a.1 and aqp8a.1 co-overexpression, n = 25). F, Quantification of the diameters of ISV, DA, and PCV. Each data point represents an individual vessel diameter measurement of ISV, DA, and PCV. Five fishes are analysed for each group. Data are shown as mean ± s.e.m. One-way ANOVA analysis is applied. *P < 0.05. **P < 0.01. ****P < 0.0001. Scale bars, 100 μm. |