FIGURE SUMMARY
Title

Small extracellular vesicles promote stiffness-mediated metastasis

Authors
Sneider, A., Liu, Y., Starich, B., Du, W., Nair, P.R., Marar, C., Faqih, N., Ciotti, G.E., Kim, J.H., Krishnan, S., Ibrahim, S., Igboko, M., Locke, A., Lewis, D.M., Hong, H., Karl, M.N., Vij, R., Russo, G.C., Gómez-de-Mariscal, E., Habibi, M., Muñoz-Barrutia, A., Gu, L., Eisinger-Mathason, T.S.K., Wirtz, D.
Source
Full text @ Cancer Res Commun

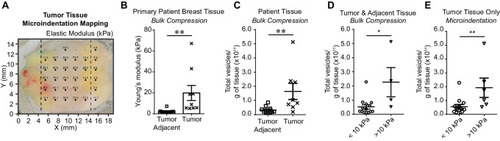
Matrix stiffness impacts the quantity of EVs produced by patient tissue. A, Representative primary breast tumor tissue. Sample has been mechanically mapped using microindentation. Dark circles indicate measurements of the elastic modulus expressed in units of kPa. Crosses are nonmeasurable indentations. Dotted lines indicate where the tissue was sectioned into stiff (middle) and soft (right) regions for subsequent vesicle collection. B, Mean compression measurements (kPa, mean ± SEM) of patient tumor and adjacent normal tissues. Ten adjacent normal tissue samples and nine tumor tissue samples. Nonparametric t test. C, Vesicles released per gram of tissue in pathologist determined tumor adjacent or tumor tissue patient samples. Ten normal tissue samples and eight tumor tissue samples. D, Combined tumor-adjacent and tumor tissues samples separated by mean compression measurements (kPa, mean ± SEM). Fourteen samples < 10 kPa and four samples > 10 kPa. E, Tumor samples separated by mean microindentation measurements (kPa, mean ± SEM). Thirteen samples < 10 kPa and six samples > 10 kPa. Nonparametric t test.

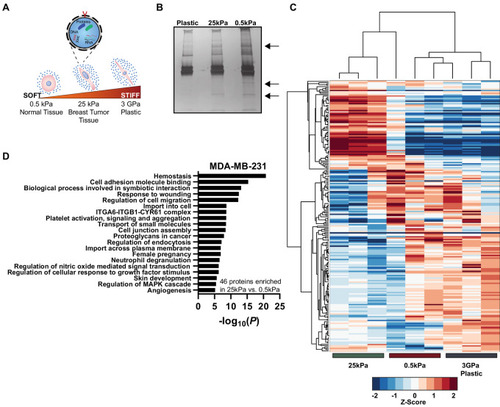
EV cargo is affected by matrix stiffness. A, Schematic of EV secretion by cancer cells on standard plastic, tumor (25 kPa) stiffness and normal tissue (0.5 kPa) stiffness. B, Silver stain of EV isolated proteins. C, Clustergram of EV protein abundance values. The color scale corresponds to the log2 normalized z-scored abundance values scaled to −2 and 2 for visual clarity. Three biological repeats. See also Supplementary Table S2. D, Gene ontology pathway analysis using Metascape for MDA-MB-231 EV proteins enriched in stiff EVs over soft EVs (79). Three biological repeats.

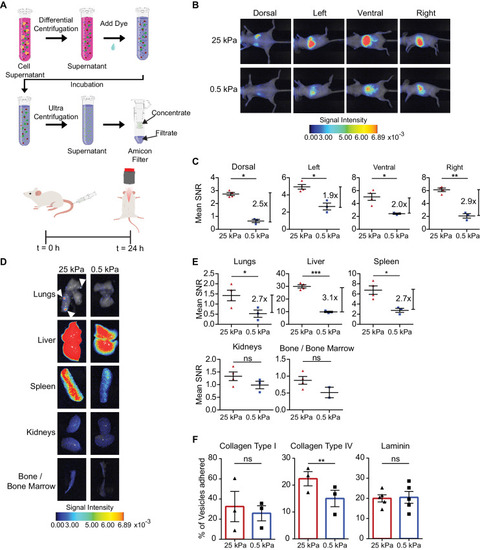
Stiff EVs show increased biodistribution and retention in vivo.A, Schematic of EV isolation and staining prior to tail-vein injection of 10 µg of EVs in nude mice. NIR imaging (B) and mean SNR (C) of MDA-MB-231 vesicle biodistribution in dorsal, left, ventral, and right sides (mean ± SEM). Signal intensity is in arbitrary units (a.u.). Three mice in 0.5 kPa condition, and four in 25 kPa condition; one-way ANOVA. NIR imaging (D) and mean SNR biodistribution (E) in the lungs, liver, spleen, kidneys, and bone/bone marrow (mean ± SEM). Signal intensity is in arbitrary units (a.u.). Three mice in MDA-MB-231 0.5 kPa condition and four in 25 kPa condition; one-way ANOVA. F, MDA-MB-231 EV binding assay to ECM proteins collagen type I, collagen type IV, and laminin (mean ± SEM). Three biological repeats for collagen type I and collagen type IV; five for laminin. Paired t test.

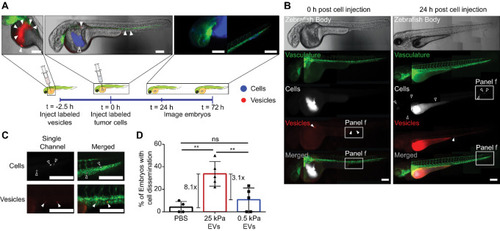
Stiff EVs promote cancer cell migration and dissemination. A, Schematic of 2-day GFP+ zebrafish embryo model system used to test the ability of MDA-MB-231 EVs (red, filled triangles) to disperse MDA-MB-231 cancer cells (blue, open triangles). Scale bar, 100 µm. B, Full zebrafish body images of the embryos at time 0 and 24 hours postinjection of MDA-MB-231 cancer cells. Scale bar, 100 µm. Representative images. C, Enlarged images of disseminated MDA-MB-231 cells (white) and EVs (red). Scale bar, 100 µm. Representative images. D, Percentage of injected embryos with cancer cell dissemination to the head or the tail. Total number of fish per condition is 47 for PBS control, 63 for 25 kPa, and 78 for 0.5 kPa condition. Five biological repeats of EVs. One-way ANOVA.

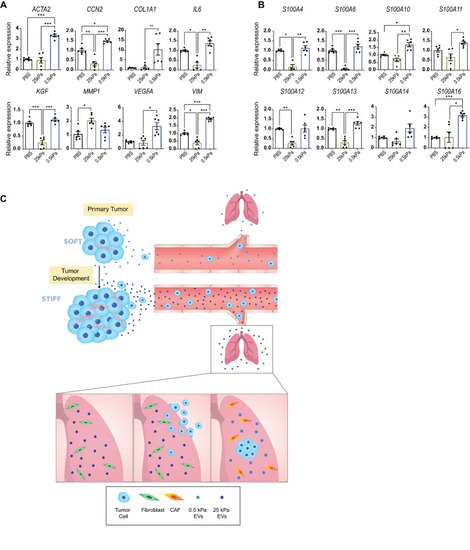
Soft EVs transform the phenotype of resident lung fibroblasts. A and B, Gene expression fold change in ACTA2, CCN2, COL1A1, IL6, KGF, MMP1, VIM, VEGFA, S100A4, S100A6, S100A10, S100A11, S100A12, S100A13, S100A14, S100A16 assessed by qRT-PCR in IMR90 human lung fibroblasts exposed to PBS only, 25 kPa EVs, and 0.5 kPa EVs. Gene expression data normalized to PBS condition. Two biological repeats. Welch ANOVA. C, Schematic showing the arrival of stiff EVs in the lung after being secreted from the primary tumor. Left panel shows a mechanically soft environment, and EVs encountering resident normal lung fibroblasts; (middle) cancer cells are then recruited to the lung; and (right) the cells, now experiencing a soft environment, release soft EVs that transform the resident fibroblasts to a CAF phenotype.

Acknowledgments
This image is the copyrighted work of the attributed author or publisher, and ZFIN has permission only to display this image to its users. Additional permissions should be obtained from the applicable author or publisher of the image. Full text @ Cancer Res Commun