IMAGE

FIGURE 3

ID
ZDB-IMAGE-240511-9
Source
Figures for Sneider et al., 2024
Image
Figure Caption

FIGURE 3

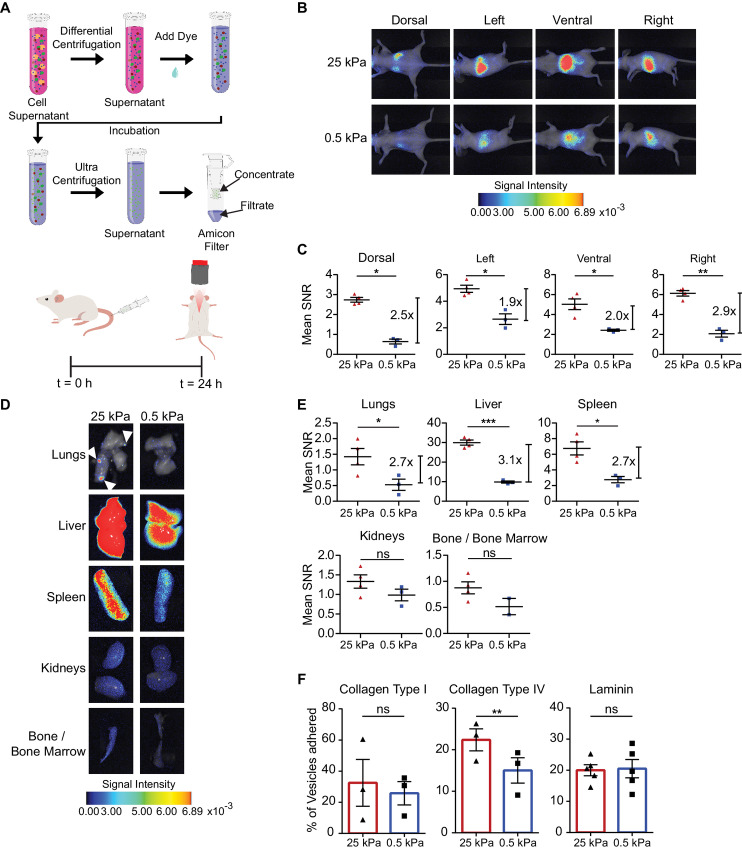
Stiff EVs show increased biodistribution and retention in vivo.A, Schematic of EV isolation and staining prior to tail-vein injection of 10 µg of EVs in nude mice. NIR imaging (B) and mean SNR (C) of MDA-MB-231 vesicle biodistribution in dorsal, left, ventral, and right sides (mean ± SEM). Signal intensity is in arbitrary units (a.u.). Three mice in 0.5 kPa condition, and four in 25 kPa condition; one-way ANOVA. NIR imaging (D) and mean SNR biodistribution (E) in the lungs, liver, spleen, kidneys, and bone/bone marrow (mean ± SEM). Signal intensity is in arbitrary units (a.u.). Three mice in MDA-MB-231 0.5 kPa condition and four in 25 kPa condition; one-way ANOVA. F, MDA-MB-231 EV binding assay to ECM proteins collagen type I, collagen type IV, and laminin (mean ± SEM). Three biological repeats for collagen type I and collagen type IV; five for laminin. Paired t test.

Acknowledgments
This image is the copyrighted work of the attributed author or publisher, and ZFIN has permission only to display this image to its users. Additional permissions should be obtained from the applicable author or publisher of the image. Full text @ Cancer Res Commun