IMAGE

FIGURE 1

ID
ZDB-IMAGE-240511-7
Source
Figures for Sneider et al., 2024
Image
Figure Caption

FIGURE 1

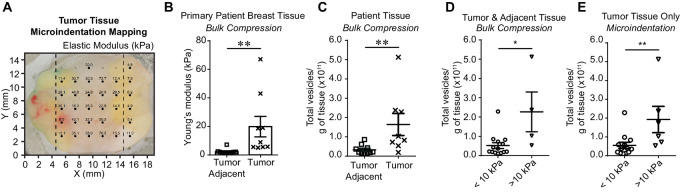
Matrix stiffness impacts the quantity of EVs produced by patient tissue. A, Representative primary breast tumor tissue. Sample has been mechanically mapped using microindentation. Dark circles indicate measurements of the elastic modulus expressed in units of kPa. Crosses are nonmeasurable indentations. Dotted lines indicate where the tissue was sectioned into stiff (middle) and soft (right) regions for subsequent vesicle collection. B, Mean compression measurements (kPa, mean ± SEM) of patient tumor and adjacent normal tissues. Ten adjacent normal tissue samples and nine tumor tissue samples. Nonparametric t test. C, Vesicles released per gram of tissue in pathologist determined tumor adjacent or tumor tissue patient samples. Ten normal tissue samples and eight tumor tissue samples. D, Combined tumor-adjacent and tumor tissues samples separated by mean compression measurements (kPa, mean ± SEM). Fourteen samples < 10 kPa and four samples > 10 kPa. E, Tumor samples separated by mean microindentation measurements (kPa, mean ± SEM). Thirteen samples < 10 kPa and six samples > 10 kPa. Nonparametric t test.

Acknowledgments
This image is the copyrighted work of the attributed author or publisher, and ZFIN has permission only to display this image to its users. Additional permissions should be obtained from the applicable author or publisher of the image. Full text @ Cancer Res Commun