FIGURE SUMMARY
Title

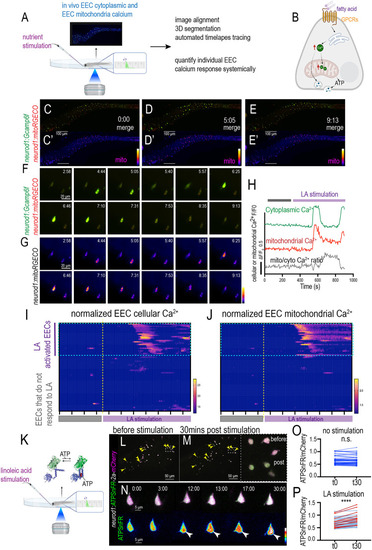
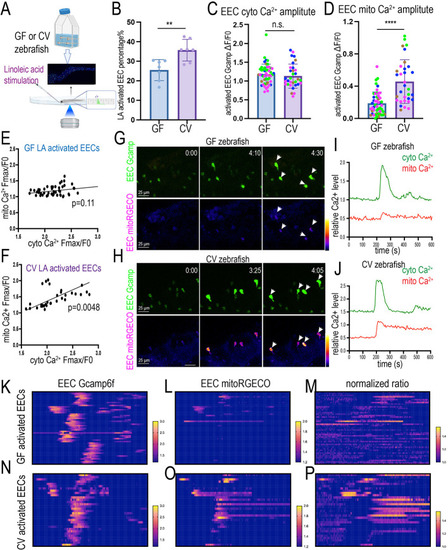
Gut microbiota regulates the nutrient sensing enteroendocrine cell maturation and mitochondrial function

Authors
Alsudayri, A., Perelman, S., Brewer, M., Chura, A., McDevitt, M., Drerup, C., Ye, L.
Source
Full text @ Development

EECs change morphology during development in a microbial-dependent manner. (A-B′) Confocal projections of the Tg(neurod1:lifeActin-EGFP) 3 dpf and 6 dpf zebrafish proximal intestine. The EECs in the 3 dpf but not 6 dpf intestine exhibit thin actin filaments in the basal lateral membrane. (C,C′,E,E′) Live imaging traces EECs of the same zebrafish at 3 dpf (C) and 6 dpf (E). The EEC actin filaments are labeled via the Tg(neurod1:lifeActin-EGFP). (D,D′,F,F′) Magnified view showing a typical 3 dpf EEC and 6 dpf EEC. Note that at 3 dpf, active actin filaments are observed at the basal lateral membrane. At 6 dpf, the actin filaments are only enriched in the apical brush border. (G-H′) Confocal projection of the 7 dpf Tg(neurod1:lifeActin-EGFP); Tg(neurod1:TagRFP) GF and CV zebrafish proximal intestine. Yellow arrows indicate the EECs that contain actin filaments labeled by neurod1:lifeActin-EGFP. (I,J) Representative EECs in 7 dpf GF and CV zebrafish proximal intestine. Yellow arrows indicate the presence of actin filament protrusions at the GF EEC base that are labeled by lifeActin-EGFP but not by TagRFP. (K) Quantification of the percentage of EECs with actin filaments in GF and CV conditions. Each dot represents an individual zebrafish. Zebrafish samples were pooled from three independent derivation experiments (samples from one derivation experiment are labeled by the same color): 2597 EECs were analyzed in CV and 2043 EECs were analyzed in GF. Data are mean±s.d. ****P<0.0001 (unpaired, two-tailed Student's t-test). Scale bars: 20 μm.

Gut microbiota modulate EEC subtypes. (A) Gnotobiotic zebrafish experimental procedure to examine the effects of gut microbiota on EEC subtype formation. (B-C′) Confocal projection of representative 7 dpf GF and CV zebrafish showing the PYY+ EECs (red). The total EECs were labeled by the Tg(neurod1:EGFP) transgene (green). (D-E′) Confocal projection of representative GF and CV zebrafish intestine at 7 dpf showing the ENK+ EECs (red). (F-G′) Confocal projection of representative GF and CV zebrafish intestine showing the sst2:RFP+ EECs in the intestine. (H-I′) Confocal projection of representative GF and CV zebrafish intestine showing the gcga:EGFP+ EECs in the intestine. Dashed white outlines in B-I′ indicate the proximal zebrafish intestine (intestinal bulb). (J-N) Quantification of the total number of EECs (J), percentage of PYY+ EECs (K), percentage of ENK+ EECs (L), percentage of sst2+ EECs (M) and percentage of gcga+ EECs in 7 dpf GF and CV zebrafish proximal intestine. Each dot represents an individual zebrafish. Samples were pooled from three derivation experiments (J,M,N) and one derivation experiment (K,L). Data are mean±s.d. *P<0.05 (unpaired, two-tailed Student's t-test). n.s., not significant. Scale bars: 100 μm.

Gut microbiota promote EEC maturation and mitochondrial function. (A) Experimental overview for transcriptomic analysis of the FACS-sorted EECs from 8 dpf Tg(neurod1:RFP); Tg(cldn15la:EGFP) GF and CV zebrafish. Tg(cldn15la:EGFP) labels the intestine epithelium and Tg(neurod1:RFP) labels the EECs in the intestinal epithelium. Cells with both GFP and RFP fluorescence were sorted. (B) Positive correlation between the genes that are upregulated in CV (x-axis) and the genes that are enriched in EECs (y-axis). (C) Among the genes that are significantly upregulated in CV (red), 74.5% are enriched in the EECs. (D) Of the EECs signature genes shared between zebrafish and mammals, 72% are upregulated in CV. (E) Differential expression of the EEC signature genes that encode hormone peptides or are involved in membrane potential in GF and CV conditions. Asterisks indicate that the genes are significantly upregulated in the GF or CV conditions. (F) Volcano plot showing the genes that are significantly upregulated in CV or GF. (G) GO term analysis of the CV or GF upregulated genes. (H) Volcano plot showing the genes that are involved in mitochondrial function. Many of the genes that are associated with mitochondrial regulation are among the most significantly upregulated genes in CV EECs. (I) Model figure showing that commensal microbiota colonization promotes EEC maturation and mitochondrial function.

Commensal microbiota colonization promotes mitochondria accumulation at the EEC basal lateral membrane. (A-B″) Confocal projections of representative 3 dpf and 7 dpf zebrafish proximal intestine. The EECs were labeled via the neurod1:RFP transgene, and the EEC mitochondria were labeled via the neurod1:mitoEOS transgene. Mitochondria in 7 dpf EECs but not in 3 dpf EECs display a punctate distribution pattern. (C-E′) Magnification showing representative EECs in 3 dpf and 7 dpf zebrafish proximal intestine. Mitochondria are evenly distributed in 3 dpf but not 7 dpf EEC cytoplasm. White arrows indicate mitochondria hotspots at the EEC base and neck. Dashed yellow outlines indicate individual EECs. (F) Quantification of percentage of EECs displaying mitochondria hotspot pattern in 3 dpf and 7 dpf zebrafish proximal intestine. Each dot represents an individual zebrafish. (G,H) Quantification of mitochondrial distribution profiles in 3 dpf (G) and 7 dpf (H) zebrafish proximal intestinal EECs. Compared with 3 dpf zebrafish EECs, 7 dpf zebrafish EECs display higher mitochondrial contents at the EEC base: 36 EECs from five 3 dpf zebrafish and 36 EECs from five 7 dpf zebrafish were analyzed. (I-J′) Confocal projections of representative 7 dpf Tg(neurod1:mitoEOS); Tg(neurod1:RFP) GF and CV zebrafish proximal intestine. Asterisks indicate the EECs that display an even mitochondrial hotspot distribution pattern. (K-L′) Magnification showing representative EECs in 7 dpf GF and CV zebrafish proximal intestine. Mitochondria were evenly distributed within the GF EEC cytoplasm but displayed a hotspot pattern in CV EECs. White arrows indicate the mitochondrial hotspot at the EEC base. (M) Quantification of the percentage of EECs without basal mitochondrial hotspots in 7 dpf GF and CV zebrafish proximal intestine. Each dot represents an individual zebrafish. Zebrafish samples pooled from three independent derivation experiments were analyzed (samples from one derivation experiment are labeled by the same color): 3338 EECs from 36 CV zebrafish and 2697 EECs from 34 GF zebrafish were analyzed. (N) Quantification of the mitochondrial fluorescence intensity at the basal membrane in 7 dpf GF and CV zebrafish proximal intestine: 15 zebrafish from three independent derivation experiments were analyzed in each group, and >120 EECs from each zebrafish were analyzed. Each dot represents an individual EEC. The EECs from the same derivation experiments are labeled with the same color. Data are mean±s.d. ****P<0.0001 (unpaired, two-tailed Student's t-test). Scale bars: 50 μm (A,B); 10 μm (C-E′,K-L′); 20 μm (I-J′).

EEC mitochondrial activity changes during development. (A) Schematic showing in vivo imaging to trace the EEC cytoplasmic and mitochondrial Ca2+ in the same zebrafish from 3 dpf to 6 dpf. The commensal microbiota colonizing conventionally raised zebrafish was used. EECs from nine zebrafish were traced and analyzed. (B-E″) Confocal projections of the same Tg(neurod1:Gcamp6f); Tg(neurod1:mitoRGECO) zebrafish at 3 dpf, 4 dpf, 5 dpf, and 6 dpf. The EEC cytoplasmic Ca2+ level is represented via the Gcamp6f fluorescence (green). The EEC mitochondrial Ca2+ level is displayed through mitoRGECO fluorescence (magenta). (F-H) EECs from the same zebrafish were analyzed from 3 dpf to 6 dpf. EEC mitochondria-to-cytoplasmic Ca2+ ratio, cytoplasmic Ca2+ and mitochondrial Ca2+ were quantified. (I-K) Pooled EECs from nine zebrafish were analyzed from 3 dpf to 6 dpf. Mitochondria-to-cytoplasmic Ca2+ ratio, cytoplasmic Ca2+ and mitochondrial Ca2+ were quantified. Each dot in F-K represents an individual EEC. Dashed lines indicate the changes of EEC cellular and mitochondrial calcium activity from 3 dpf to 7 dpf. Data are mean±s.d. *P<0.05, **P<0.01, ***P<0.001, ****P<0.0001 (one-way Anova followed by Tukey's post test). Scale bars: 50 μm.

Commensal microbiota colonization alters the resting EEC cytoplasm and mitochondria Ca2+ activity. (A) Schematic showing in vivo imaging of EEC cellular and mitochondrial Ca2+ activity in live zebrafish. (B-C″) Confocal projection of 7 dpf GF and CV Tg(neurod1:Gcamp6f); Tg(neurod1:mitoRGECO) zebrafish proximal intestine. The white arrowheads in B″ and C″ indicate the EECs with higher mitochondrial activity near the base membrane. (D,E) Representative GF and CV zebrafish EECs in the proximal intestine. The white arrow in E indicates high mitochondrial Ca2+ near the base membrane. (F-H) Quantification of absolute Gcamp (F), mitoRGECO (G) and mitoRGECO/Gcamp ratio (H) in 7 dpf GF and CV zebrafish proximal intestinal EECs. Each dot represents an EEC: 523 EECs from four GF zebrafish and 575 EECs from five CV zebrafish were analyzed. EECs from the same GF or CV zebrafish are labeled with the same color. Three independent derivation experiments were performed, and the same trend was observed. (I-N) Analysis of the relative EEC Gcamp (I,L), EEC mitoRGECO (J,M) and EEC mitoRGECO/Gcamp ratio (K,N) in GF (I-K) and CV (L-N) zebrafish on a temporal scale. The EEC Gcamp, EEC mitoRGECO and EEC mitoRGECO/Gcamp ratio at each time point were normalized to t0. Each line represents an individual EEC. The red boxed areas indicate the EECs that exhibit dynamic Gcamp fluorescence fluctuation, referred to as active EECs in O and P. (O,P) Quantification of the percentage of the quiet and active EECs in GF and CV zebrafish: 581 EECs from four GF zebrafish and 398 EECs from five CV zebrafish were used for the analysis in I-P. A second independent derivation experiment with five GF zebrafish and five CV zebrafish was performed, and the same conclusion was reached. Data are mean±s.d. ****P<0.0001 (unpaired, two-tailed Student's t-test). Scale bars: 20 µm (B-C″); 5 µm (D,E).

Analysis of individual EEC cellular and mitochondrial activity in response to nutrient stimulation in live zebrafish. (A) Schematic showing in vivo imaging of EEC cellular and mitochondrial Ca2+ activity in response to nutrient stimulation. (B) The hypothesis model figure shows that fatty acid increases both cytoplasmic and mitochondrial Ca2+, which powers the hormone vesicle secretion from EECs. (C-E′) Time-lapse images of the whole zebrafish intestinal EEC cytoplasmic and mitochondrial Ca2+ change post linoleic acid stimulation. The EEC cytoplasmic Ca2+ was labeled by Gcamp6f (green) and the EEC mitochondrial Ca2+ was labeled by mitoRGECO (magenta). (F,G) Magnification shows two representative EECs that are activated by linoleic acid. (H) Analysis of fluorescence change of Gcamp, mitoRGECO and mitoRGECO/Gcamp ratio in a representative linoleic acid-activated EEC. (I,J) Analysis of fluorescence change of Gcamp and mitoRGECO of 68 EECs in one zebrafish before and after linoleic acid stimulation. The EECs that increase cytoplasmic Ca2+ were defined as ‘LA-activated EECs’. Most of the LA-activated EECs also exhibited increased mitochondrial Ca2+. (K) Schematic showing measurement of EEC ATP concentration using zebrafish injected with neurod1:ATPSnFR-2a-mCherry plasmid. The ATPSnFR/mCherry ratio is used to measure the ATP concentration within EECs. (L,M) Confocal projection of the zebrafish intestine before and 30 min after linoleic acid stimulation. The yellow arrowheads indicate the EECs that exhibit a significant increase in the ATPSnFR/mCherry ratio upon linoleic acid stimulation. (N) Time-lapse imaging of a representative EEC that increased ATPSnFR/mCherry ratio after linoleic acid stimulation. White arrowheads indicate, at 12, 13, 17 and 30 min post linoleic acid stimulation, a representative EEC displaying an increased ATPSnFR fluorescence level. (O-P) The ATPSnFR/mCherry ratio of the EECs at 0 min (t0) and 30 min (t30) in unstimulated (O) and linoleic acid-stimulated (P) zebrafish. The red lines in P indicate the EECs that increased the ATPSnFR/mCherry ratio by more than 15%. More than 100 EECs from three zebrafish were analyzed for K-P. ****P<0.0001 (paired, two-tailed Student's t-test). Scale bars: 100 μm (C-E′); 20 μm (F,G); 50 μm (L,M); 5 μm (N).

Nutrient-induced EEC mitochondrial Ca2+ increase requires commensal microbiota colonization. (A) Schematic showing in vivo imaging to analyze the 7 dpf GF and CV zebrafish EEC cytoplasm and mitochondrial activity in response to linoleic acid stimulation. (B) Quantification of linoleic acid-activated EEC percentage in GF and CV zebrafish. Each dot represents an individual zebrafish. (C,D) Quantification of the linoleic acid-activated EEC cytoplasmic Ca2+ amplitude (C) and the mitochondrial Ca2+ amplitude (D). Each dot represents an individual EEC. EECs from four GF and four CV zebrafish were analyzed. The EECs from the same GF or CV zebrafish are labeled with the same color. (E,F) Correlation between cytoplasmic Ca2+ amplification and mitochondrial Ca2+ amplification in GF (E) and CV (F) zebrafish EECs. (G,H) Time-lapse images of the representative EECs post linoleic acid stimulation in GF (G) and CV (H) zebrafish. The EEC cytoplasmic Ca2+ was labeled by Gcamp6f and the EEC mitochondrial Ca2+ was labeled by mitoRGECO. (I,J) Analysis of fluorescence change of Gcamp and mitoRGECO in representative linoleic acid-activated GF (I) and CV (J) EECs. (K-P) Analysis of the change of the EEC Gcamp6f fluorescence (K,N), EEC mitoRGECO fluorescence (L,O) and EEC mitoRGECO/Gcamp6f ratio (M,P) in GF and CV zebrafish. Only the linoleic acid-activated EECs were plotted. Analysis of 32 activated EECs from four CV zebrafish and 50 activated EECs from four GF zebrafish. A second independent derivation experiment was performed in which seven GF zebrafish and seven CV zebrafish were analyzed, and the same conclusion was reached for all data presented in this figure. Data are mean±s.d. **P<0.01, ****P<0.0001 (unpaired, two-tailed Student's t-test). n.s., not significant. Scale bars: 25 μm.

Acknowledgments
This image is the copyrighted work of the attributed author or publisher, and ZFIN has permission only to display this image to its users. Additional permissions should be obtained from the applicable author or publisher of the image. Full text @ Development