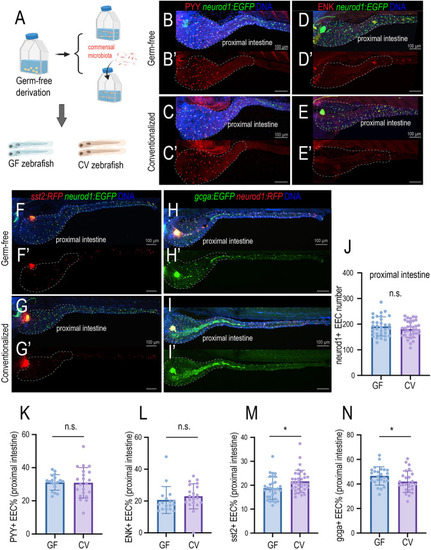
Gut microbiota modulate EEC subtypes. (A) Gnotobiotic zebrafish experimental procedure to examine the effects of gut microbiota on EEC subtype formation. (B-C′) Confocal projection of representative 7 dpf GF and CV zebrafish showing the PYY+ EECs (red). The total EECs were labeled by the Tg(neurod1:EGFP) transgene (green). (D-E′) Confocal projection of representative GF and CV zebrafish intestine at 7 dpf showing the ENK+ EECs (red). (F-G′) Confocal projection of representative GF and CV zebrafish intestine showing the sst2:RFP+ EECs in the intestine. (H-I′) Confocal projection of representative GF and CV zebrafish intestine showing the gcga:EGFP+ EECs in the intestine. Dashed white outlines in B-I′ indicate the proximal zebrafish intestine (intestinal bulb). (J-N) Quantification of the total number of EECs (J), percentage of PYY+ EECs (K), percentage of ENK+ EECs (L), percentage of sst2+ EECs (M) and percentage of gcga+ EECs in 7 dpf GF and CV zebrafish proximal intestine. Each dot represents an individual zebrafish. Samples were pooled from three derivation experiments (J,M,N) and one derivation experiment (K,L). Data are mean±s.d. *P<0.05 (unpaired, two-tailed Student's t-test). n.s., not significant. Scale bars: 100 μm.
|
