IMAGE

Fig. 5.

ID
ZDB-IMAGE-240524-138
Source
Figures for Alsudayri et al., 2024
Image
Figure Caption

Fig. 5.

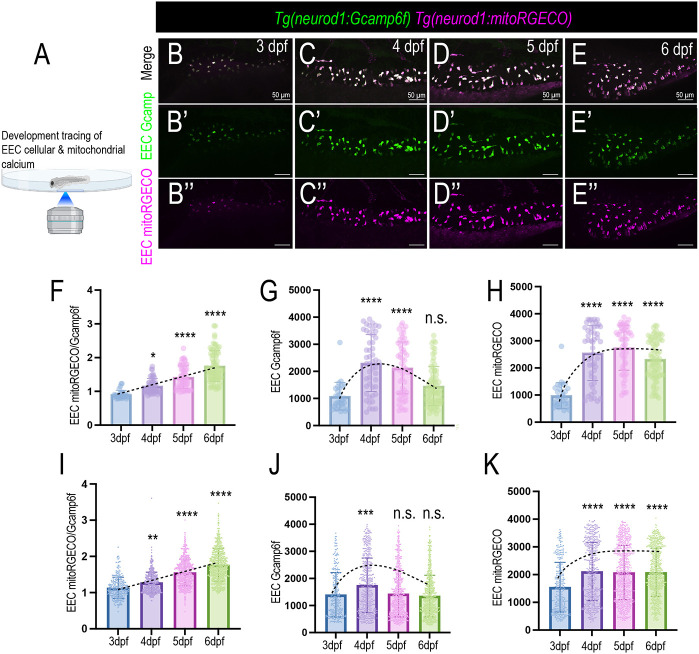
EEC mitochondrial activity changes during development. (A) Schematic showing in vivo imaging to trace the EEC cytoplasmic and mitochondrial Ca2+ in the same zebrafish from 3 dpf to 6 dpf. The commensal microbiota colonizing conventionally raised zebrafish was used. EECs from nine zebrafish were traced and analyzed. (B-E″) Confocal projections of the same Tg(neurod1:Gcamp6f); Tg(neurod1:mitoRGECO) zebrafish at 3 dpf, 4 dpf, 5 dpf, and 6 dpf. The EEC cytoplasmic Ca2+ level is represented via the Gcamp6f fluorescence (green). The EEC mitochondrial Ca2+ level is displayed through mitoRGECO fluorescence (magenta). (F-H) EECs from the same zebrafish were analyzed from 3 dpf to 6 dpf. EEC mitochondria-to-cytoplasmic Ca2+ ratio, cytoplasmic Ca2+ and mitochondrial Ca2+ were quantified. (I-K) Pooled EECs from nine zebrafish were analyzed from 3 dpf to 6 dpf. Mitochondria-to-cytoplasmic Ca2+ ratio, cytoplasmic Ca2+ and mitochondrial Ca2+ were quantified. Each dot in F-K represents an individual EEC. Dashed lines indicate the changes of EEC cellular and mitochondrial calcium activity from 3 dpf to 7 dpf. Data are mean±s.d. *P<0.05, **P<0.01, ***P<0.001, ****P<0.0001 (one-way Anova followed by Tukey's post test). Scale bars: 50 μm.

Acknowledgments
This image is the copyrighted work of the attributed author or publisher, and ZFIN has permission only to display this image to its users. Additional permissions should be obtained from the applicable author or publisher of the image. Full text @ Development