IMAGE

Fig. 1.

ID
ZDB-IMAGE-240524-134
Source
Figures for Alsudayri et al., 2024
Image
Figure Caption

Fig. 1.

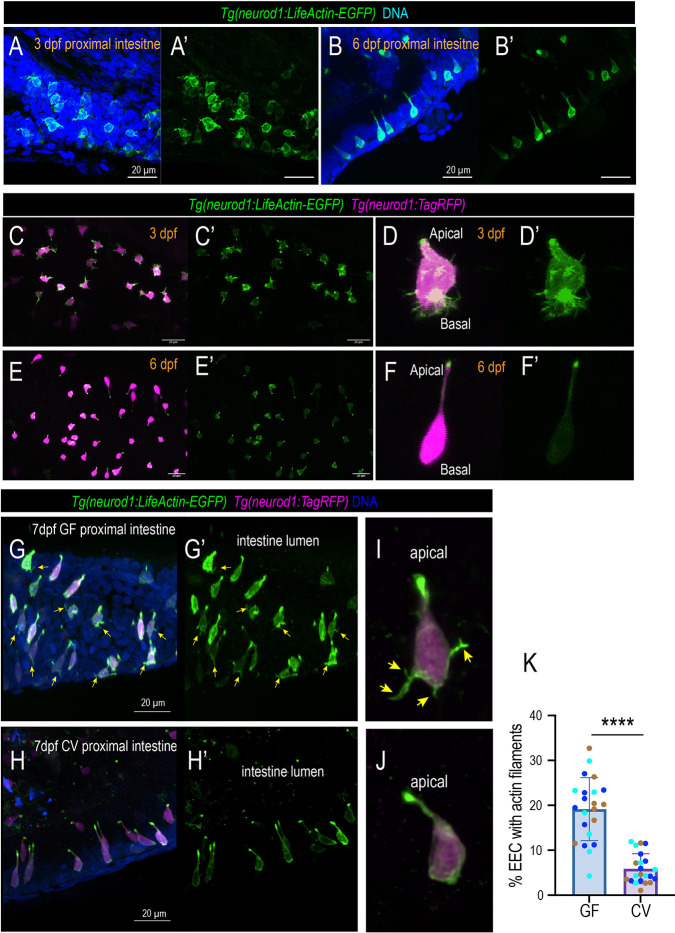
EECs change morphology during development in a microbial-dependent manner. (A-B′) Confocal projections of the Tg(neurod1:lifeActin-EGFP) 3 dpf and 6 dpf zebrafish proximal intestine. The EECs in the 3 dpf but not 6 dpf intestine exhibit thin actin filaments in the basal lateral membrane. (C,C′,E,E′) Live imaging traces EECs of the same zebrafish at 3 dpf (C) and 6 dpf (E). The EEC actin filaments are labeled via the Tg(neurod1:lifeActin-EGFP). (D,D′,F,F′) Magnified view showing a typical 3 dpf EEC and 6 dpf EEC. Note that at 3 dpf, active actin filaments are observed at the basal lateral membrane. At 6 dpf, the actin filaments are only enriched in the apical brush border. (G-H′) Confocal projection of the 7 dpf Tg(neurod1:lifeActin-EGFP); Tg(neurod1:TagRFP) GF and CV zebrafish proximal intestine. Yellow arrows indicate the EECs that contain actin filaments labeled by neurod1:lifeActin-EGFP. (I,J) Representative EECs in 7 dpf GF and CV zebrafish proximal intestine. Yellow arrows indicate the presence of actin filament protrusions at the GF EEC base that are labeled by lifeActin-EGFP but not by TagRFP. (K) Quantification of the percentage of EECs with actin filaments in GF and CV conditions. Each dot represents an individual zebrafish. Zebrafish samples were pooled from three independent derivation experiments (samples from one derivation experiment are labeled by the same color): 2597 EECs were analyzed in CV and 2043 EECs were analyzed in GF. Data are mean±s.d. ****P<0.0001 (unpaired, two-tailed Student's t-test). Scale bars: 20 μm.

Acknowledgments
This image is the copyrighted work of the attributed author or publisher, and ZFIN has permission only to display this image to its users. Additional permissions should be obtained from the applicable author or publisher of the image. Full text @ Development