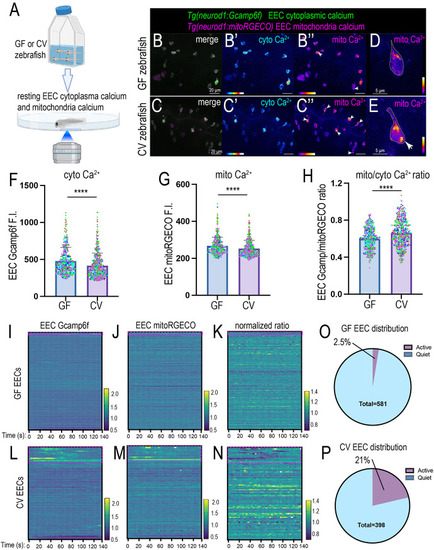
Commensal microbiota colonization alters the resting EEC cytoplasm and mitochondria Ca2+ activity. (A) Schematic showing in vivo imaging of EEC cellular and mitochondrial Ca2+ activity in live zebrafish. (B-C″) Confocal projection of 7 dpf GF and CV Tg(neurod1:Gcamp6f); Tg(neurod1:mitoRGECO) zebrafish proximal intestine. The white arrowheads in B″ and C″ indicate the EECs with higher mitochondrial activity near the base membrane. (D,E) Representative GF and CV zebrafish EECs in the proximal intestine. The white arrow in E indicates high mitochondrial Ca2+ near the base membrane. (F-H) Quantification of absolute Gcamp (F), mitoRGECO (G) and mitoRGECO/Gcamp ratio (H) in 7 dpf GF and CV zebrafish proximal intestinal EECs. Each dot represents an EEC: 523 EECs from four GF zebrafish and 575 EECs from five CV zebrafish were analyzed. EECs from the same GF or CV zebrafish are labeled with the same color. Three independent derivation experiments were performed, and the same trend was observed. (I-N) Analysis of the relative EEC Gcamp (I,L), EEC mitoRGECO (J,M) and EEC mitoRGECO/Gcamp ratio (K,N) in GF (I-K) and CV (L-N) zebrafish on a temporal scale. The EEC Gcamp, EEC mitoRGECO and EEC mitoRGECO/Gcamp ratio at each time point were normalized to t0. Each line represents an individual EEC. The red boxed areas indicate the EECs that exhibit dynamic Gcamp fluorescence fluctuation, referred to as active EECs in O and P. (O,P) Quantification of the percentage of the quiet and active EECs in GF and CV zebrafish: 581 EECs from four GF zebrafish and 398 EECs from five CV zebrafish were used for the analysis in I-P. A second independent derivation experiment with five GF zebrafish and five CV zebrafish was performed, and the same conclusion was reached. Data are mean±s.d. ****P<0.0001 (unpaired, two-tailed Student's t-test). Scale bars: 20 µm (B-C″); 5 µm (D,E).
|
