
- Title
-
odd skipped-related 2 as a novel mark for labeling the proximal convoluted tubule within the zebrafish kidney
- Authors
- Yang, W., Liu, X., He, Z., Zhang, Y., Tan, X., Liu, C.
- Source
- Full text @ Heliyon
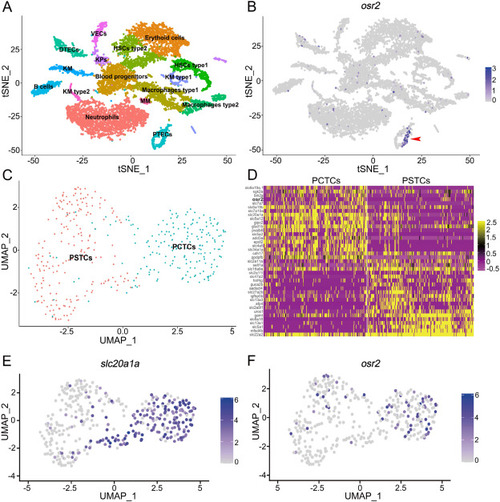
Expression pattern of osr2 in zebrafish kidney. A-B: scRNA-seq analysis showed that osr2 was expressed in PTECs. tSNE plots show zebrafish kidney cell clusters and the expression of osr2. HSCs, hematopoietic stem cells; KPs, Kidney progenitors; KM, Kidney Multiciliated; MM, Macrophages Myeloid; KM, Kidney mucin; VECs, Vascular endothelium cells; DTECs, distal tubule epithelial cells; PTECs, proximal tubule epithelial cells. C: Cluster DTECs was divided into PSTCs and PCTCs subpopulations. D: Heatmap shows relative log-expression of some genes in PCT or PST in C. E-F: Expression analysis of slc20a1a and osr2 in each subpopulation. PCTCs, proximal convoluted tubule epithelial cells; PSTCs, proximal straight tubule epithelial cells. |
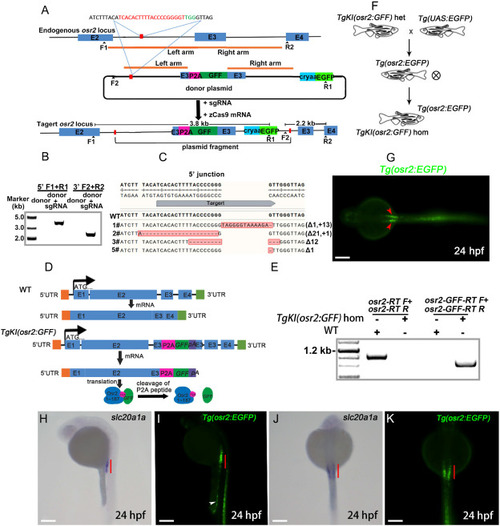
Intron targeting-mediated donor plasmid knockin at the zebrafish osr2 locus. A: Schematic representation of an intron-targeted mediated strategy for generating GFF knockin at zebrafish osr2 locus using the CRISPR/Cas9 system. The sequence of sgRNA target is shown in red, and the protospacer adjacent motif (PAM) sequence is depicted in green. The right and left arm sequences of the donor plasmid are denoted by the brown lines. The left arm is 840 bp, and the right arm is 840 bp. Following co-injection of the donor plasmid with the zCas9 mRNA and sgRNA, the whole donor plasmid fregment was integrated into the osr2 locus. The zebrafish osr2 has 4 exons, with E2, E3, and E4 representing the 2nd, 3rd, and 4th exons, respectively. B: PCR analysis of the 3′ and 5′ junctions of F1 progenies from the 3# founder. The F1, R1, F2 and R2 primers are shown in A. C: 5′ junction sequences of F1 progenies of four donor plasmid knockin F0 founders. The indel mutations are highlighted in red. D: Transcription schematic of osr2 in TgKI(osr2:GFF) and WT zebrafish. E: RT-PCR was used to verify the transcription of osr2 and GFF in TgKI (osr2:GFF) and WT zebrafish (n = 3 biological replications per group). F: Schematic diagram for obtaining TgKI(osr2:GFF) homozygotes, TgKI(osr2:GFF) heterozygotes, and Tg(osr2:EGFP) transgenic fish. G: In vivo confocal image (dorsal view) of Tg(osr2:EGFP)embryos at 24 hpf reveals EGFP expression in the pronephros as indicated by the red arrowheads. Scale bar, 500 μm. H–K: The expression patterns of slc20a1a and EGFP were examined in 24 hpf embryos. H: WISH analysis of the expression pattern of slc20a1a in 24 hpf embryos (side view). I: In vivo confocal images (side view) of osr2:EGFP embryos at 24 hpf. Posterior gut (white arrowhead). J: WISH analysis of the expression pattern of slc20a1a in 24 hpf embryos (dorsal view). K: in vivo confocal images (dorsal view) of Tg(osr2:EGFP) embryos at 24 hpf. hom, homozygotes; het, heterozygotes; pA, poly(A). Scale bar in H to K, 500 μm. (For interpretation of the references to color in this figure legend, the reader is referred to the Web version of this article.) |
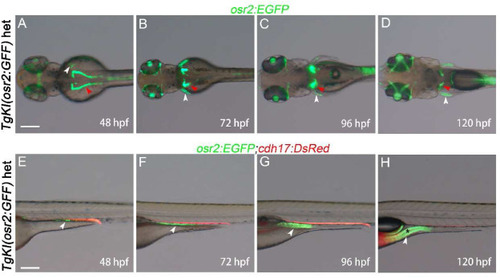
Dynamic EGFP expression pattern throughout embryogenesis in the Tg(osr2:EGFP) transgenic line. A-D: Showing the PCT dorsal view of Tg(osr2:EGFP) embryos at 48 hpf, 72 hpf, 96 hpf, and 120 hpf, respectively. Within these stages, EGFP was expressed in the PCT region (indicated by the red arrowhead) as well as in the pectoral fin (indicated by the white arrowhead). E-F: Providing lateral view of Tg(osr2:EGFP;cdh17:DsRed) embryos at the developmental stages. Posterior gut (white arrowhead) and the gut lumen (*) can be observed. het, heterozygotes. Scale bar in A to H, 500 μm. (For interpretation of the references to color in this figure legend, the reader is referred to the Web version of this article.) |

The PCT morphogenesis is labeled by EGFP in Tg(osr2:EGFP) embryos. A-E: Dorsal view of the PCT cells that are co-labeled by EGFP and DsRed at the indicated stages are shown (n = 6). osr2:EGFP expression in the pectoral fins (red arrowhead) can be observed. Scale bar in A to E, 200 μm. (For interpretation of the references to color in this figure legend, the reader is referred to the Web version of this article.) |
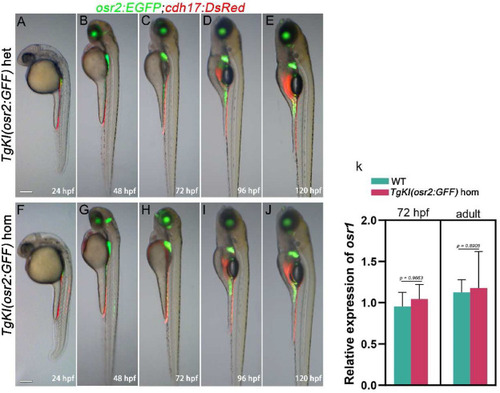
Embryo morphology of TgKI(osr2:GFF) homozygotes and TgKI(osr2:GFF) heterozygotes. A-J: Use of Tg(osr2:EGFP;cdh17:DsRed) background to show TgKI(osr2:GFF) heterozygotes (A-E) and TgKI(osr2:GFF) homozygotes (F-J) embryo developmental morphology, development of PCT and renal tubules at the indicated stages are shown (n = 6). K: qRT‒PCR analyses of osr1 in embryonic and adult TgKI(osr2:GFF) homozygous and WT zebrafish kidneys (n = 3 biological replications per group). hom, homozygotes; het, heterozygotes. Scale bar in A to J, 500 μm. The data in K were analyzed by two-sided t-test and are presented as mean values ± SD |
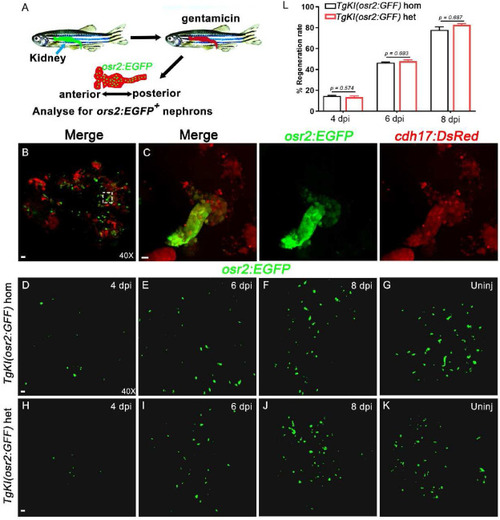
EGFP + cells regeneration in Tg(osr2:EGFP) adult zebrafish after kidney injury. A: Schematic diagram of the AKI model constructed by intraperitoneal injection of gentamicin in adult zebrafish. B: Confocal images of adult zebrafish PCT cells that are co-labeled by osr2:EGFP and cdh17:DsRed are shown (n = 6). Scale bar in A, 100 μm. C: Higher-magnification image of the boxed area showed in B. Scale bar, 200 μm. D-G: Use of osr2:EGFP background to show of PCTs in TgKI(osr2:GFF) homozygotes at the indicated time point after injured (n = 6). Scale bar, 100 μm. H–K: Use of osr2:EGFP background to show of PCTs in TgKI(osr2:GFF) heterozygotes at the indicated time point after injured (n = 6). Scale bar, 100 μm. L: After injured, the renal regeneration rate of TgKI(osr2:GFF) homozygotes and TgKI(osr2:GFF) heterozygotes were counted using ImageJ (n = 5 biological replications per group). hom, homozygotes; het, heterozygotes. Scale bar in A to J, 500 μm. |